| PANDEMIC ALERT LEVEL |
| 123456 |
| Tracking the next pandemic: Avian Flu Talk |
Global Climate Change (Temperature Puzzle) |
Post Reply 
|
Page 123 8> |
| Author | ||||||||||||||||||||||||||||||||||||||||||||||||||||||||||||||||||||||||||||||||||||||||||||||||||||||||||||||||||||||||||||||||||||||||||||||||||||||||||||||||||||||||||||||||||||||||||||||||||||||||||||||||||||||||||||||||||||||||||||||||||||||||||||||||||||||||||||||||||||||||||||||||||||||||||||||||||||||||||||||||||||
Mahshadin 
Admin Group 

Joined: January 26 2006 Location: United States Status: Offline Points: 3882 |
 Post Options Post Options
") Thanks(0) Thanks(0)
 Quote Reply Quote Reply
 Topic: Global Climate Change (Temperature Puzzle) Topic: Global Climate Change (Temperature Puzzle)Posted: January 09 2013 at 4:43am |
|||||||||||||||||||||||||||||||||||||||||||||||||||||||||||||||||||||||||||||||||||||||||||||||||||||||||||||||||||||||||||||||||||||||||||||||||||||||||||||||||||||||||||||||||||||||||||||||||||||||||||||||||||||||||||||||||||||||||||||||||||||||||||||||||||||||||||||||||||||||||||||||||||||||||||||||||||||||||||||||||||
2012 was warmest and second most extreme year on record for the contiguous U.S.2012 was a historic year for extreme weather that included drought, wildfires, hurricanes and storms; however, tornado activity was below average 2012 marked the warmest year on record for the contiguous United States with the year consisting of a record warm spring, second warmest summer, fourth warmest winter and a warmer-than-average autumn. The average temperature for 2012 was 55.3F, 3.2F above the 20th century average, and 1.0F above 1998, the previous warmest year. The average precipitation total for the contiguous U.S. for 2012 was 26.57 inches, 2.57 inches below average, making it the 15th driest year on record for the nation. At its peak in July, the drought of 2012 engulfed 61 percent of the nation with the Mountain West, Great Plains, and Midwest experiencing the most intense drought conditions. The dry conditions proved ideal for wildfires in the West, charring 9.2 million acres — the third highest on record. The U.S. Climate Extremes Index indicated that 2012 was the second most extreme year on record for the nation. The index, which evaluates extremes in temperature and precipitation, as well as landfalling tropical cyclones, was nearly twice the average value and second only to 1998. To date, 2012 has seen 11 disasters that have reached the $1 billion threshold in losses, to include Sandy, Isaac, and tornado outbreaks experienced in the Great Plains, Texas and Southeast/Ohio Valley.  U.S. temperature
U.S. precipitation
Alaska and Hawaii
Significant weather and climate events Significant weather and climate events for 2012. Click image to enlarge, or click here for the National Overview.
|
||||||||||||||||||||||||||||||||||||||||||||||||||||||||||||||||||||||||||||||||||||||||||||||||||||||||||||||||||||||||||||||||||||||||||||||||||||||||||||||||||||||||||||||||||||||||||||||||||||||||||||||||||||||||||||||||||||||||||||||||||||||||||||||||||||||||||||||||||||||||||||||||||||||||||||||||||||||||||||||||||||
|
"In a time of universal deceit, telling the truth is a revolutionary act." G Orwell
|
||||||||||||||||||||||||||||||||||||||||||||||||||||||||||||||||||||||||||||||||||||||||||||||||||||||||||||||||||||||||||||||||||||||||||||||||||||||||||||||||||||||||||||||||||||||||||||||||||||||||||||||||||||||||||||||||||||||||||||||||||||||||||||||||||||||||||||||||||||||||||||||||||||||||||||||||||||||||||||||||||||
 |
||||||||||||||||||||||||||||||||||||||||||||||||||||||||||||||||||||||||||||||||||||||||||||||||||||||||||||||||||||||||||||||||||||||||||||||||||||||||||||||||||||||||||||||||||||||||||||||||||||||||||||||||||||||||||||||||||||||||||||||||||||||||||||||||||||||||||||||||||||||||||||||||||||||||||||||||||||||||||||||||||||
|
quietprepr
V.I.P. Member

Joined: May 21 2006 Location: United States Status: Offline Points: 2495 |
Post Options
Thanks(0)
Quote Reply
Posted: January 02 2013 at 12:45pm |
|||||||||||||||||||||||||||||||||||||||||||||||||||||||||||||||||||||||||||||||||||||||||||||||||||||||||||||||||||||||||||||||||||||||||||||||||||||||||||||||||||||||||||||||||||||||||||||||||||||||||||||||||||||||||||||||||||||||||||||||||||||||||||||||||||||||||||||||||||||||||||||||||||||||||||||||||||||||||||||||||||
|
The causes of global warming, whether you believe they are natural, or man made, took generations to manifest and it will take an equally long time to do anything about it. That is if you can get people to even admit it or work on it. I saw an article a few weeks ago discussing the impact even slight temperature variations can have on crop outputs. The farmers were saying a 3-4 degree difference would drop production of staple crops such as rice, by more than 15%. With the food crunch world wide, a loss of that kind of output will surely be translated into dramatic increases in food prices. Of course, like anything that is truly important to the US population...this has been made into a political issue and it will not get proper debate by the government until it is too late.
I am no enviro nut by any means...but when it begins affecting us all, how can you ignore it?
|
||||||||||||||||||||||||||||||||||||||||||||||||||||||||||||||||||||||||||||||||||||||||||||||||||||||||||||||||||||||||||||||||||||||||||||||||||||||||||||||||||||||||||||||||||||||||||||||||||||||||||||||||||||||||||||||||||||||||||||||||||||||||||||||||||||||||||||||||||||||||||||||||||||||||||||||||||||||||||||||||||||
|
"Learning is not compulsory... neither is survival." - W. Edwards Deming
|
||||||||||||||||||||||||||||||||||||||||||||||||||||||||||||||||||||||||||||||||||||||||||||||||||||||||||||||||||||||||||||||||||||||||||||||||||||||||||||||||||||||||||||||||||||||||||||||||||||||||||||||||||||||||||||||||||||||||||||||||||||||||||||||||||||||||||||||||||||||||||||||||||||||||||||||||||||||||||||||||||||
|
Guests
Guest Group 
|
Post Options
Thanks(0)
Quote Reply
Posted: January 01 2013 at 8:05pm |
|||||||||||||||||||||||||||||||||||||||||||||||||||||||||||||||||||||||||||||||||||||||||||||||||||||||||||||||||||||||||||||||||||||||||||||||||||||||||||||||||||||||||||||||||||||||||||||||||||||||||||||||||||||||||||||||||||||||||||||||||||||||||||||||||||||||||||||||||||||||||||||||||||||||||||||||||||||||||||||||||||
|
Officials say the number of cases of whooping cough in Colorado have not been this high since 1948, when 1,833 cases were reported.
Many people in Colorado who have had the vaccine have gotten ill. So had the virus changed? I bet it has. We have too many people in the world...one day something is going to kill lots of us. Just a matter of time. |
||||||||||||||||||||||||||||||||||||||||||||||||||||||||||||||||||||||||||||||||||||||||||||||||||||||||||||||||||||||||||||||||||||||||||||||||||||||||||||||||||||||||||||||||||||||||||||||||||||||||||||||||||||||||||||||||||||||||||||||||||||||||||||||||||||||||||||||||||||||||||||||||||||||||||||||||||||||||||||||||||||
|
Elver
Valued Member 
Joined: June 14 2008 Status: Offline Points: 7778 |
Post Options
Thanks(0)
Quote Reply
Posted: January 01 2013 at 6:18pm |
|||||||||||||||||||||||||||||||||||||||||||||||||||||||||||||||||||||||||||||||||||||||||||||||||||||||||||||||||||||||||||||||||||||||||||||||||||||||||||||||||||||||||||||||||||||||||||||||||||||||||||||||||||||||||||||||||||||||||||||||||||||||||||||||||||||||||||||||||||||||||||||||||||||||||||||||||||||||||||||||||||
|
Thank the Vatican & Catholics for the population explosion.
The Vatican is a giant men's club who tell people that they can't get a divorce or use birth control. Yet, none of these old men have ever been married or had kids. None of these old men know what it is like to be abused by a husband, leave the bastard, and then have to support the kids on a salary that is typically way lower than a man's salary. This men's club likes to tell us what to do, but they aren't living in the real world, now are they?
What we need is more birth control of all varieties and less of the Catholic church.
|
||||||||||||||||||||||||||||||||||||||||||||||||||||||||||||||||||||||||||||||||||||||||||||||||||||||||||||||||||||||||||||||||||||||||||||||||||||||||||||||||||||||||||||||||||||||||||||||||||||||||||||||||||||||||||||||||||||||||||||||||||||||||||||||||||||||||||||||||||||||||||||||||||||||||||||||||||||||||||||||||||||
|
carbon20
Moderator
Joined: April 08 2006 Location: West Australia Status: Offline Points: 65816 |
Post Options
Thanks(0)
Quote Reply
Posted: December 30 2012 at 12:43pm |
|||||||||||||||||||||||||||||||||||||||||||||||||||||||||||||||||||||||||||||||||||||||||||||||||||||||||||||||||||||||||||||||||||||||||||||||||||||||||||||||||||||||||||||||||||||||||||||||||||||||||||||||||||||||||||||||||||||||||||||||||||||||||||||||||||||||||||||||||||||||||||||||||||||||||||||||||||||||||||||||||||
|
hi all
dont worry the only way to cut greenhouse gases by 50% is to cull 75% OF THE WORLDS POPULATION or stop at home for 3.5 days of the week and do nothing at all not even make a coffee , we are all to blame we just waste waste waste, the size of some people here in Australia they are so FAT thats why they need enormous cars to move there bodies around think about how you would curb your carbon footprint?? 7 billion people on the planet , we are putting a billion more people on this small planet every 7 years now, from 1800's to now the population has risen 5 billion people , before that the population for 2,000 years stood at about 2 billion, it took 100 years to get to 3 billion now a billion every 7 years and going up faster and faster, what is the answer ???? |
||||||||||||||||||||||||||||||||||||||||||||||||||||||||||||||||||||||||||||||||||||||||||||||||||||||||||||||||||||||||||||||||||||||||||||||||||||||||||||||||||||||||||||||||||||||||||||||||||||||||||||||||||||||||||||||||||||||||||||||||||||||||||||||||||||||||||||||||||||||||||||||||||||||||||||||||||||||||||||||||||||
|
Everything we hear is an opinion, not a fact. Everything we see is a perspective, not the truth.🖖
Marcus Aurelius |
||||||||||||||||||||||||||||||||||||||||||||||||||||||||||||||||||||||||||||||||||||||||||||||||||||||||||||||||||||||||||||||||||||||||||||||||||||||||||||||||||||||||||||||||||||||||||||||||||||||||||||||||||||||||||||||||||||||||||||||||||||||||||||||||||||||||||||||||||||||||||||||||||||||||||||||||||||||||||||||||||||
|
Guests
Guest Group
|
Post Options
Thanks(0)
Quote Reply
Posted: December 29 2012 at 10:10pm |
|||||||||||||||||||||||||||||||||||||||||||||||||||||||||||||||||||||||||||||||||||||||||||||||||||||||||||||||||||||||||||||||||||||||||||||||||||||||||||||||||||||||||||||||||||||||||||||||||||||||||||||||||||||||||||||||||||||||||||||||||||||||||||||||||||||||||||||||||||||||||||||||||||||||||||||||||||||||||||||||||||
|
Elver, yes I too am concerned...way too warm for Colorado all year. We are going to have the dust bowl all over again I fear. That is why I have 2 years of wheat to make bread.
If you want to blame global warming then blame, China, and emerging third world countries not just America. Europe does it's part also. If this is man made heat well we may be doomed. We have gotten away from God and he may turn his back on us. I pray not but look all around us...you make your own conclusions. |
||||||||||||||||||||||||||||||||||||||||||||||||||||||||||||||||||||||||||||||||||||||||||||||||||||||||||||||||||||||||||||||||||||||||||||||||||||||||||||||||||||||||||||||||||||||||||||||||||||||||||||||||||||||||||||||||||||||||||||||||||||||||||||||||||||||||||||||||||||||||||||||||||||||||||||||||||||||||||||||||||||
|
Mahshadin
Admin Group
Joined: January 26 2006 Location: United States Status: Offline Points: 3882 |
Post Options
Thanks(0)
Quote Reply
Posted: December 29 2012 at 8:56am |
|||||||||||||||||||||||||||||||||||||||||||||||||||||||||||||||||||||||||||||||||||||||||||||||||||||||||||||||||||||||||||||||||||||||||||||||||||||||||||||||||||||||||||||||||||||||||||||||||||||||||||||||||||||||||||||||||||||||||||||||||||||||||||||||||||||||||||||||||||||||||||||||||||||||||||||||||||||||||||||||||||
|
I will say that some people do make efforts. I live in Phoenix and I ration water, I dont have to do it, but it sure does save some money over a years time. I have found that most plants including grass has a starvation mode where the plant basically shuts off or more acurately goes in to slow motion. It is a pain but I do it anyway. Everything here is on auto pilot, they should put the controls on the inside of the house, so perhaps people might notice they have some control over it. Sometime I wont water for 2 weeks or more if we get a litttle sprinkle. Funny thing is it had nice side effects, now I only have to cut the grass once a month instead of every week or every other week (Less Work). Your right though most people just let the auto-pilot do its thing twice a day. Pools are a whole different animal. I deem a pool a must for where I live and how quickly water could become scarce. I can turn my pool into usable water in a mater of hours, worste case a few days. As far as filling pools, it isnt neccessary all that often if you take the time to balance the water chemistry throughout the year (PH). Hardness is the one thing that gets you here, at some point the pool will require a flush. And once emptied you can not just leave it there empty, big trouble in little china (Expensive Mistake). This also gives me a healthy supply of chlorine, acid, and baking soda which all have multiple uses in a SIP type situation. This time of year its not a big deal, once the water temp goes low enough its pretty self-sustaining with little adjustments here and there. Most people use to much chlorine in the water or just have a pool service that drops by once a week to once a month. Tried this, but the workers they sent didnt have a clue about water chemistry they just used the little stick tester adjusted the chlorine and left after clenaing the floor. I also cut back on cycle time which isnt a problem either, this saves a lot on electricity in the winter. It is just not neccessary to cyle the pools water (Turns) in the winter Funny story, my sister lives with me right now and she has 2 poodles, they think there in charge when we go outside barking a throwing a big fusss everytime. We just had first frost of the year and the pool water is quite cold (Stinging cold). So its morning and I am just getting up have cup of coffee in one hand and my laptop in the other, so I open the sliding door and the poodles go flying out and one forgets to turn and runs right into the pool. It was funny because the dog had a moment where he was stil in the air and looked back at me with shear panic in his eyes (Plush). I dont know if this dog found some super special energy or somthing but he hits the water goes under and then springs up out of the water atleast 6 to 12 inches and does another pitiful help me look. All this happens in like 3 seconds, just waking up I threw the the laptop and coffee on the table spilling the coffee on the laptop, now I have a choice, save the laptop or the dog. I find the big net get the dog out and he is like a very large shaking ice cube. The only casualty was the net was ripped. Dog lived, and laptop was closed so didnt get inside before I could get to it. |
||||||||||||||||||||||||||||||||||||||||||||||||||||||||||||||||||||||||||||||||||||||||||||||||||||||||||||||||||||||||||||||||||||||||||||||||||||||||||||||||||||||||||||||||||||||||||||||||||||||||||||||||||||||||||||||||||||||||||||||||||||||||||||||||||||||||||||||||||||||||||||||||||||||||||||||||||||||||||||||||||||
|
"In a time of universal deceit, telling the truth is a revolutionary act." G Orwell
|
||||||||||||||||||||||||||||||||||||||||||||||||||||||||||||||||||||||||||||||||||||||||||||||||||||||||||||||||||||||||||||||||||||||||||||||||||||||||||||||||||||||||||||||||||||||||||||||||||||||||||||||||||||||||||||||||||||||||||||||||||||||||||||||||||||||||||||||||||||||||||||||||||||||||||||||||||||||||||||||||||||
|
Elver
Valued Member
Joined: June 14 2008 Status: Offline Points: 7778 |
Post Options
Thanks(0)
Quote Reply
Posted: December 29 2012 at 12:01am |
|||||||||||||||||||||||||||||||||||||||||||||||||||||||||||||||||||||||||||||||||||||||||||||||||||||||||||||||||||||||||||||||||||||||||||||||||||||||||||||||||||||||||||||||||||||||||||||||||||||||||||||||||||||||||||||||||||||||||||||||||||||||||||||||||||||||||||||||||||||||||||||||||||||||||||||||||||||||||||||||||||
|
I believe it. We've had the warmest November that I can ever remember here in Colorado.
I put Denver's preciption into a spreadsheet and graphed it. It looked like we've had lower than average precipition for 19 of the past 21 years.
I've read that Lake Mead might be dry by 2021. In my earlier post I mentioned that we in the Denver area have been on water rationing for some years now, but it doesn't seem like the people in Vegas or Los Angeles care about water rationing. Our water on the front range goes primarily to agriculture also, but we still have to watch what we use. I don't understand why anyone out west is allowed to fill up their swimming pools with Lake Mead drying up. It is down 99 feet and is only 52.57% full.
I guess nobody really cares about this, but one day it will be too late. Food shortages will be a really nasty side effect to this.
|
||||||||||||||||||||||||||||||||||||||||||||||||||||||||||||||||||||||||||||||||||||||||||||||||||||||||||||||||||||||||||||||||||||||||||||||||||||||||||||||||||||||||||||||||||||||||||||||||||||||||||||||||||||||||||||||||||||||||||||||||||||||||||||||||||||||||||||||||||||||||||||||||||||||||||||||||||||||||||||||||||||
|
Mahshadin
Admin Group
Joined: January 26 2006 Location: United States Status: Offline Points: 3882 |
Post Options
Thanks(0)
Quote Reply
Posted: December 27 2012 at 6:10pm |
|||||||||||||||||||||||||||||||||||||||||||||||||||||||||||||||||||||||||||||||||||||||||||||||||||||||||||||||||||||||||||||||||||||||||||||||||||||||||||||||||||||||||||||||||||||||||||||||||||||||||||||||||||||||||||||||||||||||||||||||||||||||||||||||||||||||||||||||||||||||||||||||||||||||||||||||||||||||||||||||||||
November 2012 global temperatures were fifth highest on recordThe globally-averaged temperature for November 2012 marked the fifth warmest November since record keeping began in 1880. November 2012 also marks the 36th consecutive November and 333rd consecutive month with a global temperature above the 20th century average. |
||||||||||||||||||||||||||||||||||||||||||||||||||||||||||||||||||||||||||||||||||||||||||||||||||||||||||||||||||||||||||||||||||||||||||||||||||||||||||||||||||||||||||||||||||||||||||||||||||||||||||||||||||||||||||||||||||||||||||||||||||||||||||||||||||||||||||||||||||||||||||||||||||||||||||||||||||||||||||||||||||||
|
"In a time of universal deceit, telling the truth is a revolutionary act." G Orwell
|
||||||||||||||||||||||||||||||||||||||||||||||||||||||||||||||||||||||||||||||||||||||||||||||||||||||||||||||||||||||||||||||||||||||||||||||||||||||||||||||||||||||||||||||||||||||||||||||||||||||||||||||||||||||||||||||||||||||||||||||||||||||||||||||||||||||||||||||||||||||||||||||||||||||||||||||||||||||||||||||||||||
|
||||||||||||||||||||||||||||||||||||||||||||||||||||||||||||||||||||||||||||||||||||||||||||||||||||||||||||||||||||||||||||||||||||||||||||||||||||||||||||||||||||||||||||||||||||||||||||||||||||||||||||||||||||||||||||||||||||||||||||||||||||||||||||||||||||||||||||||||||||||||||||||||||||||||||||||||||||||||||||||||||||
|
Mahshadin
Admin Group
Joined: January 26 2006 Location: United States Status: Offline Points: 3882 |
Post Options
Thanks(0)
Quote Reply
Posted: December 27 2012 at 6:09pm |
|||||||||||||||||||||||||||||||||||||||||||||||||||||||||||||||||||||||||||||||||||||||||||||||||||||||||||||||||||||||||||||||||||||||||||||||||||||||||||||||||||||||||||||||||||||||||||||||||||||||||||||||||||||||||||||||||||||||||||||||||||||||||||||||||||||||||||||||||||||||||||||||||||||||||||||||||||||||||||||||||||
I hear you ElverIts getting to the point where its in your face (Hard To Ignore)
|
||||||||||||||||||||||||||||||||||||||||||||||||||||||||||||||||||||||||||||||||||||||||||||||||||||||||||||||||||||||||||||||||||||||||||||||||||||||||||||||||||||||||||||||||||||||||||||||||||||||||||||||||||||||||||||||||||||||||||||||||||||||||||||||||||||||||||||||||||||||||||||||||||||||||||||||||||||||||||||||||||||
|
"In a time of universal deceit, telling the truth is a revolutionary act." G Orwell
|
||||||||||||||||||||||||||||||||||||||||||||||||||||||||||||||||||||||||||||||||||||||||||||||||||||||||||||||||||||||||||||||||||||||||||||||||||||||||||||||||||||||||||||||||||||||||||||||||||||||||||||||||||||||||||||||||||||||||||||||||||||||||||||||||||||||||||||||||||||||||||||||||||||||||||||||||||||||||||||||||||||
|
||||||||||||||||||||||||||||||||||||||||||||||||||||||||||||||||||||||||||||||||||||||||||||||||||||||||||||||||||||||||||||||||||||||||||||||||||||||||||||||||||||||||||||||||||||||||||||||||||||||||||||||||||||||||||||||||||||||||||||||||||||||||||||||||||||||||||||||||||||||||||||||||||||||||||||||||||||||||||||||||||||
|
Elver
Valued Member
Joined: June 14 2008 Status: Offline Points: 7778 |
Post Options
Thanks(0)
Quote Reply
Posted: December 10 2012 at 10:28pm |
|||||||||||||||||||||||||||||||||||||||||||||||||||||||||||||||||||||||||||||||||||||||||||||||||||||||||||||||||||||||||||||||||||||||||||||||||||||||||||||||||||||||||||||||||||||||||||||||||||||||||||||||||||||||||||||||||||||||||||||||||||||||||||||||||||||||||||||||||||||||||||||||||||||||||||||||||||||||||||||||||||
|
We've never had to start watering our lawn here in Colorado until May, but our lawn was drying up in mid April. We usually quit mowing by October 1st, but we mowed just before Halloween for what we thought was the last time, but then had to mow just before Thanksgiving again! In June our home was ruined by the worst hail storm I've ever been in. We had to get new shingles, new garage doors, exterior paint, 1 new window, and 4 screens. We turned our sprinkler system on after Thanksgiving in order to water our lawn again because it has been really dry here. We've since turned it back off again, but I've had to hand water our shrubs and trees or damage will occur.
I live in the Denver area & a few years ago I saw 2 perfectly formed tornado's out our TV room window. A few years prior to this I was only 3 miles from home & saw another tornado to the north and east. I've lived here since 1972 & have never heard of tornados this close to Denver.
This past summer was the worst fire season I can ever remember. We had smoke all summer long. After the Colorado fires were out we got the smoke from either the north west or New Mexico. We normally have a terrific view of the mountains from our deck, but couldn't see them most of the summer. We like to sit on the deck at night during the summer, but it was way too hot this year.
Based on how warm it has been so far this fall, I'm concerned that it will be bad next spring and summer too.
I wasn't sure I believed in global warming, but the charts you've pasted above make me think otherwise. The only other explanation would be that we have cycles greater than 100+ years since record keeping began. I'm thinking that the world shouldn't bet on this though.
|
||||||||||||||||||||||||||||||||||||||||||||||||||||||||||||||||||||||||||||||||||||||||||||||||||||||||||||||||||||||||||||||||||||||||||||||||||||||||||||||||||||||||||||||||||||||||||||||||||||||||||||||||||||||||||||||||||||||||||||||||||||||||||||||||||||||||||||||||||||||||||||||||||||||||||||||||||||||||||||||||||||
|
Mahshadin
Admin Group
Joined: January 26 2006 Location: United States Status: Offline Points: 3882 |
Post Options
Thanks(0)
Quote Reply
Posted: December 09 2012 at 7:47pm |
|||||||||||||||||||||||||||||||||||||||||||||||||||||||||||||||||||||||||||||||||||||||||||||||||||||||||||||||||||||||||||||||||||||||||||||||||||||||||||||||||||||||||||||||||||||||||||||||||||||||||||||||||||||||||||||||||||||||||||||||||||||||||||||||||||||||||||||||||||||||||||||||||||||||||||||||||||||||||||||||||||
|
"In a time of universal deceit, telling the truth is a revolutionary act." G Orwell
|
||||||||||||||||||||||||||||||||||||||||||||||||||||||||||||||||||||||||||||||||||||||||||||||||||||||||||||||||||||||||||||||||||||||||||||||||||||||||||||||||||||||||||||||||||||||||||||||||||||||||||||||||||||||||||||||||||||||||||||||||||||||||||||||||||||||||||||||||||||||||||||||||||||||||||||||||||||||||||||||||||||
|
||||||||||||||||||||||||||||||||||||||||||||||||||||||||||||||||||||||||||||||||||||||||||||||||||||||||||||||||||||||||||||||||||||||||||||||||||||||||||||||||||||||||||||||||||||||||||||||||||||||||||||||||||||||||||||||||||||||||||||||||||||||||||||||||||||||||||||||||||||||||||||||||||||||||||||||||||||||||||||||||||||
|
Mahshadin
Admin Group
Joined: January 26 2006 Location: United States Status: Offline Points: 3882 |
Post Options
Thanks(0)
Quote Reply
Posted: December 08 2012 at 3:34pm |
|||||||||||||||||||||||||||||||||||||||||||||||||||||||||||||||||||||||||||||||||||||||||||||||||||||||||||||||||||||||||||||||||||||||||||||||||||||||||||||||||||||||||||||||||||||||||||||||||||||||||||||||||||||||||||||||||||||||||||||||||||||||||||||||||||||||||||||||||||||||||||||||||||||||||||||||||||||||||||||||||||
|
Been slacking on this post (Updates since July) August 2012 USA http://www.ncdc.noaa.gov/sotc/national/2012/8 Global The average combined global land and ocean surface temperature for August
2012 was 0.62°C (1.12°F) above the 20th century average of 15.6°C
(60.1°F). This is the fourth warmest August since records began in 1880. http://www.avianflutalk.com/forum_posts.asp?TID=26490&PN=22 September 2012 USA The average contiguous U.S.
temperature during September was 66.3°F, 1.5°F above the 20th
century average, the 18th
warmest such month on record. September 2012 marks the 16th consecutive
month with above-average temperatures for the Lower 48. http://www.ncdc.noaa.gov/sotc/national/2012/9 Global The average combined global land and ocean surface temperature for
September 2012 tied with 2005 as the warmest September on record, at 0.67°C
(1.21°F) above the 20th century average of 15.0°C (59.0°F). Records
began in 1880. http://www.ncdc.noaa.gov/sotc/global/2012/9 October 2012 USA The average
temperature for the contiguous U.S. during October was 53.9°F,
just 0.3°F below the long-term average, ending a 16-month streak of
above-average temperatures for the lower 48 that began in June 2011. http://www.ncdc.noaa.gov/sotc/national/2012/10 Global The average combined global land and ocean surface temperature for October
2012 tied with 2008 as the fifth warmest October on record, at 0.63°C (1.13°F)
above the 20th century average of 14.0°C (57.1°F). Records began in
1880. http://www.ncdc.noaa.gov/sotc/global/2012/10 November 2012 USA The average
temperature for the contiguous U.S. during November was 44.1°F,
2.1°F above the 20th century average, tying 2004 as the 20th warmest
November on record. |
||||||||||||||||||||||||||||||||||||||||||||||||||||||||||||||||||||||||||||||||||||||||||||||||||||||||||||||||||||||||||||||||||||||||||||||||||||||||||||||||||||||||||||||||||||||||||||||||||||||||||||||||||||||||||||||||||||||||||||||||||||||||||||||||||||||||||||||||||||||||||||||||||||||||||||||||||||||||||||||||||||
|
"In a time of universal deceit, telling the truth is a revolutionary act." G Orwell
|
||||||||||||||||||||||||||||||||||||||||||||||||||||||||||||||||||||||||||||||||||||||||||||||||||||||||||||||||||||||||||||||||||||||||||||||||||||||||||||||||||||||||||||||||||||||||||||||||||||||||||||||||||||||||||||||||||||||||||||||||||||||||||||||||||||||||||||||||||||||||||||||||||||||||||||||||||||||||||||||||||||
|
||||||||||||||||||||||||||||||||||||||||||||||||||||||||||||||||||||||||||||||||||||||||||||||||||||||||||||||||||||||||||||||||||||||||||||||||||||||||||||||||||||||||||||||||||||||||||||||||||||||||||||||||||||||||||||||||||||||||||||||||||||||||||||||||||||||||||||||||||||||||||||||||||||||||||||||||||||||||||||||||||||
|
Mahshadin
Admin Group
Joined: January 26 2006 Location: United States Status: Offline Points: 3882 |
Post Options
Thanks(0)
Quote Reply
Posted: August 09 2012 at 9:09am |
|||||||||||||||||||||||||||||||||||||||||||||||||||||||||||||||||||||||||||||||||||||||||||||||||||||||||||||||||||||||||||||||||||||||||||||||||||||||||||||||||||||||||||||||||||||||||||||||||||||||||||||||||||||||||||||||||||||||||||||||||||||||||||||||||||||||||||||||||||||||||||||||||||||||||||||||||||||||||||||||||||
State of the ClimateNational Oceanic and Atmospheric AdministrationNational Climatic Data CenterJuly 2012: hottest month on record for contiguous United StatesDrought expands to cover nearly 63% of the Lower 48; wildfires consume 2 million acres The average temperature for the contiguous U.S. during July was 77.6F, 3.3F above the 20th century average, marking the hottest July and the hottest month on record for the nation. The previous warmest July for the nation was July 1936 when the average U.S. temperature was 77.4F. The warm July temperatures contributed to a record-warm first seven months of the year and the warmest 12-month period the nation has experienced since recordkeeping began in 1895. Precipitation totals were mixed during July, with the contiguous U.S. as a whole being drier than average. The nationally averaged precipitation total of 2.57 inches was 0.19 inch below average. Near-record dry conditions were present for the middle of the nation, with the drought footprint expanding to cover nearly 63 percent of the Lower 48, according the U.S. Drought Monitor. Significant climate events for July 2012. Click to enlarge, or click here for the National Overview. Note: The July Monthly Climate Report for the United States has several pages of supplemental information and data regarding some of the exceptional events from the month and season.  U.S. climate highlights: July
Drought conditions update
Year-to-date: January-July
Year-to-date temperature, by month, for 2012 (red), compared to the other 117 years on record for the contiguous U.S., with the five ultimately warmest years (orange) and five ultimately coolest years (blue) noted. The 2012 data are still preliminary. Please click for a more thorough explanation.
12-month period: August 2011-July 2012
The ten warmest 12-month periods of the U.S. record. Click to enlarge, or click here for expanded information. |
||||||||||||||||||||||||||||||||||||||||||||||||||||||||||||||||||||||||||||||||||||||||||||||||||||||||||||||||||||||||||||||||||||||||||||||||||||||||||||||||||||||||||||||||||||||||||||||||||||||||||||||||||||||||||||||||||||||||||||||||||||||||||||||||||||||||||||||||||||||||||||||||||||||||||||||||||||||||||||||||||||
|
"In a time of universal deceit, telling the truth is a revolutionary act." G Orwell
|
||||||||||||||||||||||||||||||||||||||||||||||||||||||||||||||||||||||||||||||||||||||||||||||||||||||||||||||||||||||||||||||||||||||||||||||||||||||||||||||||||||||||||||||||||||||||||||||||||||||||||||||||||||||||||||||||||||||||||||||||||||||||||||||||||||||||||||||||||||||||||||||||||||||||||||||||||||||||||||||||||||
|
||||||||||||||||||||||||||||||||||||||||||||||||||||||||||||||||||||||||||||||||||||||||||||||||||||||||||||||||||||||||||||||||||||||||||||||||||||||||||||||||||||||||||||||||||||||||||||||||||||||||||||||||||||||||||||||||||||||||||||||||||||||||||||||||||||||||||||||||||||||||||||||||||||||||||||||||||||||||||||||||||||
|
Mahshadin
Admin Group
Joined: January 26 2006 Location: United States Status: Offline Points: 3882 |
Post Options
Thanks(0)
Quote Reply
Posted: July 31 2012 at 10:20am |
|||||||||||||||||||||||||||||||||||||||||||||||||||||||||||||||||||||||||||||||||||||||||||||||||||||||||||||||||||||||||||||||||||||||||||||||||||||||||||||||||||||||||||||||||||||||||||||||||||||||||||||||||||||||||||||||||||||||||||||||||||||||||||||||||||||||||||||||||||||||||||||||||||||||||||||||||||||||||||||||||||
Former Global Warming Skeptic Makes a 'Total Turnaround'by Natalie Wolchover Date: 30 July 2012  Muller co-founded the Berkeley Earth Surface Temperature (BEST) team two years ago in order to independently assess what he viewed as questionable evidence of global warming. In a series of papers published last year, BEST presented their statistical analysis of 1.6 billion temperature reports spanning the last 200 years, controlling for possible biases in the data that are often cited by skeptics as reasons to doubt the reality of global warming. Their analysis indicated that global warming is real - that the average global land temperature has risen by 2.5 degrees Fahrenheit (1.4 degrees Celsius) since 1750, including 1.5 degrees F (0.9 degrees Celsius) in the past 50 years. The numbers closely agree with the findings of past studies by the National Oceanic and Atmospheric Administration (NOAA), NASA and others; but finally, they were rigorous enough to satisfy Muller. Now, in a brand new study that probed the causes of that warming, the BEST team says it has cleared from blame the natural variations in Earth's climate that so often get implicated by skeptics. Muller and his colleagues implicate carbon dioxide emissions by humans as essentially the sole cause of global warming. "The carbon dioxide curve gives a better match than anything else we've tried," he wrote Saturday (July 28) in a New York Times editorial. "Its magnitude is consistent with the calculated greenhouse effect - extra warming from trapped heat radiation. These facts don't prove causality and they shouldn't end skepticism, but they raise the bar: To be considered seriously, an alternative explanation must match the data at least as well as carbon dioxide does." That's a high bar indeed. In graphs released with the new study, a red line representing the atmoaspheric concentration of CO2 crawls across the decades almost exactly tracing the black line representing the observed warming of the Earth. [What Are Climate Change Skeptics Still Skeptical About?] By comparison, the study found that natural variability, including variations in the solar cycle, El Nino events and the Atlantic multidecadal oscillation (shifts in sea-surface temperatures that run in cycles), could have accounted for no more than 0.17 degrees Celsius of temperature variation - either warming or cooling - during the past 150 years. These natural forces are much subtler than the warming seen during the same time period. In fact, the new results indicate that humans have been warming the Earth for longer than climate scientists previously thought certain. "In its 2007 report, the [United Nations Intergovernmental Panel on Climate Change] concluded only that most of the warming of the prior 50 years could be attributed to humans," Muller wrote. "It was possible, according to the I.P.C.C. consensus statement, that the warming before 1956 could be because of changes in solar activity, and that even a substantial part of the more recent warming could be natural." Not so, according to the new findings; variations in solar activity have a negligible effect on Earth's temperature. The handiwork is almost all our own. "I embarked on this analysis to answer questions that, to my mind, had not been answered," Muller wrote. "I hope that the Berkeley Earth analysis will help settle the scientific debate regarding global warming and its human causes. Then comes the difficult part: agreeing across the political and diplomatic spectrum about what can and should be done." |
||||||||||||||||||||||||||||||||||||||||||||||||||||||||||||||||||||||||||||||||||||||||||||||||||||||||||||||||||||||||||||||||||||||||||||||||||||||||||||||||||||||||||||||||||||||||||||||||||||||||||||||||||||||||||||||||||||||||||||||||||||||||||||||||||||||||||||||||||||||||||||||||||||||||||||||||||||||||||||||||||||
|
"In a time of universal deceit, telling the truth is a revolutionary act." G Orwell
|
||||||||||||||||||||||||||||||||||||||||||||||||||||||||||||||||||||||||||||||||||||||||||||||||||||||||||||||||||||||||||||||||||||||||||||||||||||||||||||||||||||||||||||||||||||||||||||||||||||||||||||||||||||||||||||||||||||||||||||||||||||||||||||||||||||||||||||||||||||||||||||||||||||||||||||||||||||||||||||||||||||
|
||||||||||||||||||||||||||||||||||||||||||||||||||||||||||||||||||||||||||||||||||||||||||||||||||||||||||||||||||||||||||||||||||||||||||||||||||||||||||||||||||||||||||||||||||||||||||||||||||||||||||||||||||||||||||||||||||||||||||||||||||||||||||||||||||||||||||||||||||||||||||||||||||||||||||||||||||||||||||||||||||||
|
Mahshadin
Admin Group
Joined: January 26 2006 Location: United States Status: Offline Points: 3882 |
Post Options
Thanks(0)
Quote Reply
Posted: July 29 2012 at 8:43am |
|||||||||||||||||||||||||||||||||||||||||||||||||||||||||||||||||||||||||||||||||||||||||||||||||||||||||||||||||||||||||||||||||||||||||||||||||||||||||||||||||||||||||||||||||||||||||||||||||||||||||||||||||||||||||||||||||||||||||||||||||||||||||||||||||||||||||||||||||||||||||||||||||||||||||||||||||||||||||||||||||||
|
Lake Superior is so hot right now!
By Philip Bump Lake Superior is the largest and northernmost Great Lake, containing almost three times as much water as Lake Michigan, the second largest in volume. In fact, it contains more water than the other Great Lakes combined. Which should mean that it�s cold.  Calling it hotis a stretch but all of the water is heating up far more than expected. From Climate Central (Which is also the source of the chart)
The chart itself is pretty amazing. At no point in 2012 has the surface temperature been below average, and it�s now spiking well above. Temperatures today range from 70 degrees at the southern shore to 60 at the northern-most points.  The Whole Article Below |
||||||||||||||||||||||||||||||||||||||||||||||||||||||||||||||||||||||||||||||||||||||||||||||||||||||||||||||||||||||||||||||||||||||||||||||||||||||||||||||||||||||||||||||||||||||||||||||||||||||||||||||||||||||||||||||||||||||||||||||||||||||||||||||||||||||||||||||||||||||||||||||||||||||||||||||||||||||||||||||||||||
|
"In a time of universal deceit, telling the truth is a revolutionary act." G Orwell
|
||||||||||||||||||||||||||||||||||||||||||||||||||||||||||||||||||||||||||||||||||||||||||||||||||||||||||||||||||||||||||||||||||||||||||||||||||||||||||||||||||||||||||||||||||||||||||||||||||||||||||||||||||||||||||||||||||||||||||||||||||||||||||||||||||||||||||||||||||||||||||||||||||||||||||||||||||||||||||||||||||||
|
||||||||||||||||||||||||||||||||||||||||||||||||||||||||||||||||||||||||||||||||||||||||||||||||||||||||||||||||||||||||||||||||||||||||||||||||||||||||||||||||||||||||||||||||||||||||||||||||||||||||||||||||||||||||||||||||||||||||||||||||||||||||||||||||||||||||||||||||||||||||||||||||||||||||||||||||||||||||||||||||||||
|
Mahshadin
Admin Group
Joined: January 26 2006 Location: United States Status: Offline Points: 3882 |
Post Options
Thanks(0)
Quote Reply
Posted: July 26 2012 at 9:03am |
|||||||||||||||||||||||||||||||||||||||||||||||||||||||||||||||||||||||||||||||||||||||||||||||||||||||||||||||||||||||||||||||||||||||||||||||||||||||||||||||||||||||||||||||||||||||||||||||||||||||||||||||||||||||||||||||||||||||||||||||||||||||||||||||||||||||||||||||||||||||||||||||||||||||||||||||||||||||||||||||||||
Greenland ice sheet melted at unprecedented rate during JulyScientists at Nasa admitted they thought satellite readings were a mistake after images showed 97% surface melt over four days Suzanne Goldenberg US environment correspondent 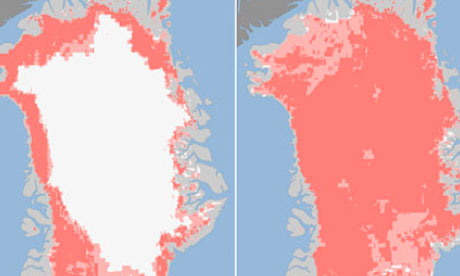 The Greenland ice sheet on July 8, left, and four days later on the right. In the image, the areas classified as 'probable melt' (light pink) correspond to those sites where at least one satellite detected surface melting. The areas classified as 'melt' (dark pink) correspond to sites where two or three satellites detected surface melting. Photograph: Nasa The Greenland ice sheet melted at a faster rate this month than at any other time in recorded history, with virtually the entire ice sheet showing signs of thaw. The rapid melting over just four days was captured by three satellites. It has stunned and alarmed scientists, and deepened fears about the pace and future consequences of climate change. In a statement posted on Nasa's website on Tuesday, scientists admitted the satellite data was so striking they thought at first there had to be a mistake. "This was so extraordinary that at first I questioned the result: was this real or was it due to a data error?" Son Nghiem of Nasa's Jet Propulsion Laboratory in Pasadena said in the release. He consulted with several colleagues, who confirmed his findings. Dorothy Hall, who studies the surface temperature of Greenland at Nasa's space flight centre in Greenbelt, Maryland, confirmed that the area experienced unusually high temperatures in mid-July, and that there was widespread melting over the surface of the ice sheet. Climatologists Thomas Mote, at the University of Georgia, and Marco Tedesco, of the City University of New York, also confirmed the melt recorded by the satellites. However, scientists were still coming to grips with the shocking images on Tuesday. "I think it's fair to say that this is unprecedented," Jay Zwally, a glaciologist at Nasa's Goddard Space Flight Center, told the Guardian. The set of images released by Nasa on Tuesday show a rapid thaw between 8 July and 12 July. Within that four-day period, measurements from three satellites showed a swift expansion of the area of melting ice, from about 40% of the ice sheet surface to 97%. Scientists attributed the sudden melt to a heat dome, or a burst of Greenland had returned to more typical summer conditions by 21 or But he said the event, while exceptional, should be viewed alongside "What we are seeing at the highest elevations may be a sort of sign of Zwally, who has made almost yearly trips to the Greenland ice sheet for more than three decades, said he had never seen such a rapid melt. About half of Greenland's surface ice sheet melts during a typical summer, but Zwally said he and other scientists had been recording an acceleration of that melting process over the last few decades. This year his team had to rebuild their camp, at Swiss Station, when the snow and ice supports melted. He said he had never seen such a rapid melt over his three decades of It was the second unusual event in Greenland in a matter of days, after an iceberg the size of Manhattan broke off from the Petermann glacier. But the rapid melt was viewed as more serious. "If you look at the 8 July image that might be the maximum extent of warming you would see in the summer," Zwally noted. "There have been periods when melting might have occurred at higher elevations briefly - maybe for a day or so - but to have it cover the whole of Greenland like this is unknown, certainly in the time of satellite records." Jason Box, a glaciologist at Ohio State University who returned on He said the heat dome was not necessarily a one-off. "This is now the He also said surfaces at higher elevation, now re-frozen, could be About half of Greenland's surface ice sheet melts during a typical "If we continue to observe melting events like this in upcoming years, it will be worrisome." she told Nasa. The most immediate consequences are sea level rise and a further warming of the Arctic. In the centre of Greenland, the ice remains up to 3,000 metres deep. On the edges, however, the ice is much, much thinner and has been melting into the sea. The melting ice sheet is a significant factor in sea level rise. Scientists attribute about one-fifth of the annual sea level rise, which is about 3mm every year, to the melting of the Greenland ice sheet. In this instance of this month's extreme melting, Mote said there was evidence of a heat dome over Greenland: or an unusually strong ridge of warm air. The dome is believed to have moved over Greenland on 8 July, lingering until 16 July. |
||||||||||||||||||||||||||||||||||||||||||||||||||||||||||||||||||||||||||||||||||||||||||||||||||||||||||||||||||||||||||||||||||||||||||||||||||||||||||||||||||||||||||||||||||||||||||||||||||||||||||||||||||||||||||||||||||||||||||||||||||||||||||||||||||||||||||||||||||||||||||||||||||||||||||||||||||||||||||||||||||||
|
"In a time of universal deceit, telling the truth is a revolutionary act." G Orwell
|
||||||||||||||||||||||||||||||||||||||||||||||||||||||||||||||||||||||||||||||||||||||||||||||||||||||||||||||||||||||||||||||||||||||||||||||||||||||||||||||||||||||||||||||||||||||||||||||||||||||||||||||||||||||||||||||||||||||||||||||||||||||||||||||||||||||||||||||||||||||||||||||||||||||||||||||||||||||||||||||||||||
|
||||||||||||||||||||||||||||||||||||||||||||||||||||||||||||||||||||||||||||||||||||||||||||||||||||||||||||||||||||||||||||||||||||||||||||||||||||||||||||||||||||||||||||||||||||||||||||||||||||||||||||||||||||||||||||||||||||||||||||||||||||||||||||||||||||||||||||||||||||||||||||||||||||||||||||||||||||||||||||||||||||
|
Mahshadin
Admin Group
Joined: January 26 2006 Location: United States Status: Offline Points: 3882 |
Post Options
Thanks(0)
Quote Reply
Posted: July 23 2012 at 9:42am |
|||||||||||||||||||||||||||||||||||||||||||||||||||||||||||||||||||||||||||||||||||||||||||||||||||||||||||||||||||||||||||||||||||||||||||||||||||||||||||||||||||||||||||||||||||||||||||||||||||||||||||||||||||||||||||||||||||||||||||||||||||||||||||||||||||||||||||||||||||||||||||||||||||||||||||||||||||||||||||||||||||
|
State of the Climate Global Analysis June 2012 Global Highlights
 Please Note: The data presented in this report are preliminary. Ranks and anomalies may change as more complete data are received and processed. Effective with the July 2010 State of the Climate Report, NCDC transitioned to the new version (version 3b) of the extended reconstructed sea surface temperature (ERSST) dataset. ERSST.v3b is an improved extended SST reconstruction over version 2. For more information about the differences between ERSST.v3b and ERSST.v2 and to access the most current data, please visit NCDC's Global Surface Temperature Anomalies page. IntroductionTemperature anomalies for June 2012 are shown on the dot maps below. The dot maps on the left provide a spatial representation of anomalies calculated from the Global Historical Climatology Network (GHCN) dataset of land surface stations using a 1961�1990 base period. The dot maps on the right are a product of a merged land surface and sea surface temperature (SST) anomaly analysis developed by Smith et al. (2008). For the merged land surface and SST analysis, temperature anomalies with respect to the 1971-2000 average for land and ocean are analyzed separately and then merged to form the global analysis. For more information, please visit NCDC's Global Surface Temperature Anomalies page. TemperaturesIn the atmosphere, 500-millibar height pressure anomalies correlate well with temperatures at the Earth's surface. The average position of the upper-level ridges of high pressure and troughs of low pressure�depicted by positive and negative 500-millibar height anomalies on the June 2012 map�is generally reflected by areas of positive and negative temperature anomalies at the surface, respectively. June
 The average global temperature across land and oceans during June 2012 was 0.63C (1.13F) above the 20th century average of 15.5C (59.9F) and ranked as the fourth warmest June since records began in 1880. June 2012 also marks the 36th consecutive June and 328th consecutive month with a global temperature above the 20th century average. The last below-average June temperature was June 1976 and the last below-average temperature for any month was February 1985. It was the second warmest June in the Northern Hemisphere, behind only the record warmth of 2010. The Southern Hemisphere had its 12th warmest June on record. The global land surface temperature for June was 1.07C (1.93F) above the 20th century average of 13.3C (55.9F), the warmest June on record. This is the second month in a row that the global land temperature was the warmest on record for that month. The Northern Hemisphere average land temperature, where the majority of Earth's land is located, was record warmest for June. This makes three months in a row ' April, May, and June ' in which record-high monthly land temperature records were set. Most areas experienced much higher-than-average monthly temperatures, including most of North America and Eurasia, and northern Africa. Only northern and western Europe, and the northwestern United States were notably cooler than average.
The Southern Hemisphere land temperature was the 20th warmest on record.
Across the world's oceans, the June average global sea surface temperature was 0.47�C (0.85F) above the 20th century average of 16.4C (61.5F), the 10th warmest June on record. Ocean temperatures were notably below average in the northeastern Pacific Ocean and much higher than average in the northeast Atlantic and in the Labrador Sea near Greenland. The region of the equatorial Pacific Ocean where ENSO conditions are measured also trended higher than average in June. NOAA's Climate Prediction Center issued an El Nino watch, and stated that there is an increased chance for El Ni�o beginning in July�September 2012.
Year-to-date (January-June)Following the dissipation of La Nina in April, record warmth over land during May and June and increasing ocean temperature anomalies pushed 2012 near the top 10 warmest status for the first half of the year. The combined global land and ocean average surface temperature for the January�June period was 0.52C (0.94F) above the 20th century average of 13.5C (56.3F), ranking as the 11th warmest such period on record. The greatest January-June warmth was observed over most of North America, southern Greenland, and most of Russia. The first half of 2012 was notably cooler than average across Alaska, Mongolia, and Australia.
Of note, the year-to-date global anomalies for 2012 have increased each month as the year has progressed and La Nina conditions waned - January: +0.35C (+0.65F); January-February: +0.37-C (+0.67-F); January-March: +0.39C (+0.70F); January-April: +0.46C (+0.83F); January-May: +0.50C (+0.90F), and JanuaryJune: +0.52C (+0.94F). The record for the warmest January-June was set in 2010, with a temperature that was 0.70C (1.26F) above average. 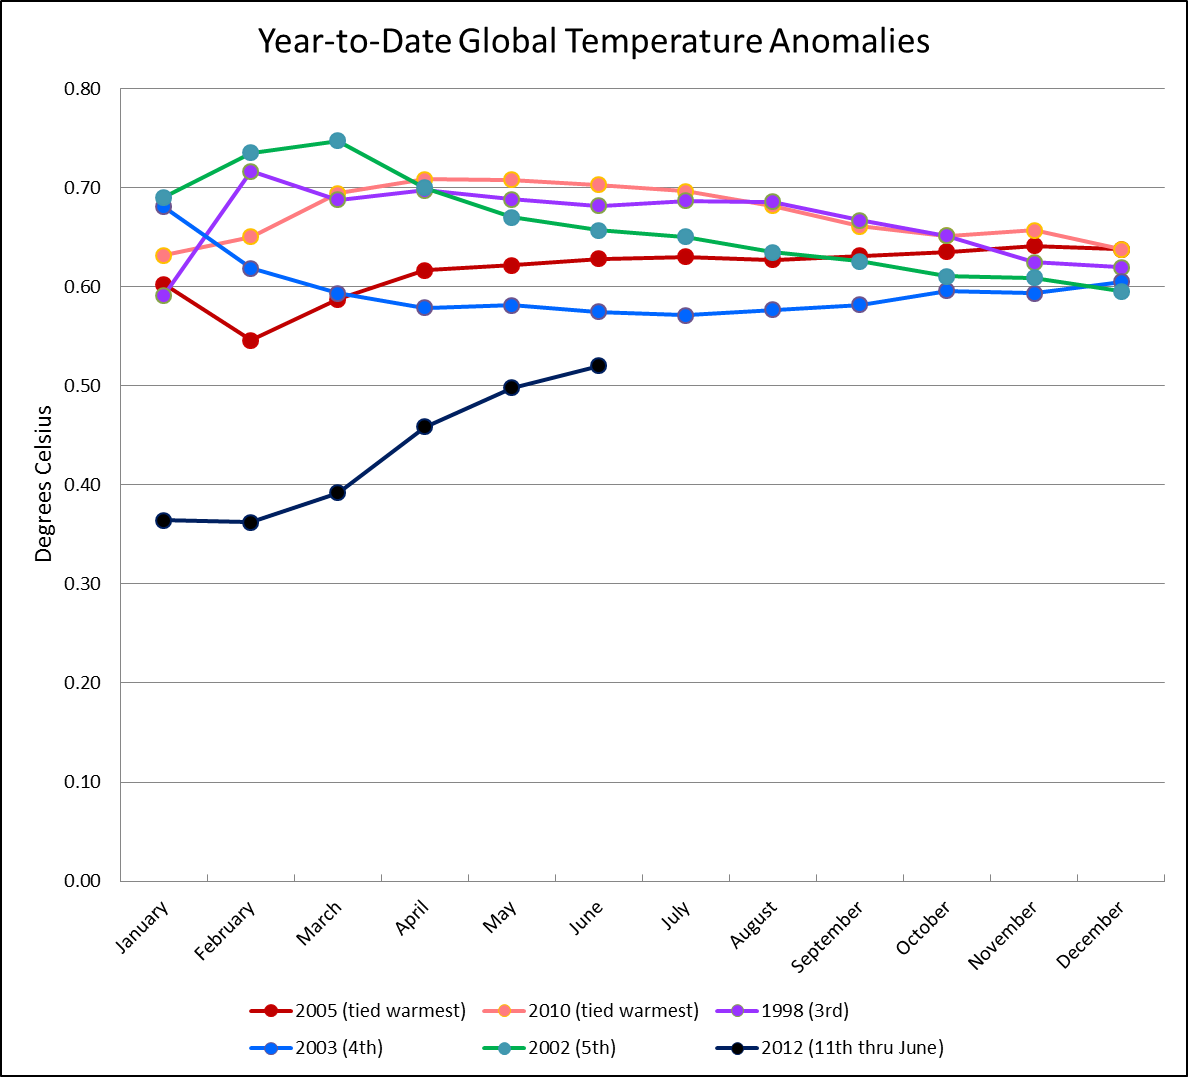 Global Year to Date Temperature Anomalies The January�June worldwide land surface temperature was 0.87C (1.57F ) above the 20th century average, marking the sixth warmest such period on record. The global ocean surface temperature for the year to date was 0.39C (0.70F) above average and ranked as the 12th warmest such period on record. This was the warmest monthly departure from average since August 2010.
 Images of sea surface temperature conditions are available for all weeks during 2012 from the weekly SST page. PrecipitationThe maps below represent anomaly values based on the GHCN dataset of land surface stations using a base period of 1961-1990. As is typical, precipitation anomalies during June 2012 varied significantly around the world.  
|
||||||||||||||||||||||||||||||||||||||||||||||||||||||||||||||||||||||||||||||||||||||||||||||||||||||||||||||||||||||||||||||||||||||||||||||||||||||||||||||||||||||||||||||||||||||||||||||||||||||||||||||||||||||||||||||||||||||||||||||||||||||||||||||||||||||||||||||||||||||||||||||||||||||||||||||||||||||||||||||||||||
|
"In a time of universal deceit, telling the truth is a revolutionary act." G Orwell
|
||||||||||||||||||||||||||||||||||||||||||||||||||||||||||||||||||||||||||||||||||||||||||||||||||||||||||||||||||||||||||||||||||||||||||||||||||||||||||||||||||||||||||||||||||||||||||||||||||||||||||||||||||||||||||||||||||||||||||||||||||||||||||||||||||||||||||||||||||||||||||||||||||||||||||||||||||||||||||||||||||||
|
||||||||||||||||||||||||||||||||||||||||||||||||||||||||||||||||||||||||||||||||||||||||||||||||||||||||||||||||||||||||||||||||||||||||||||||||||||||||||||||||||||||||||||||||||||||||||||||||||||||||||||||||||||||||||||||||||||||||||||||||||||||||||||||||||||||||||||||||||||||||||||||||||||||||||||||||||||||||||||||||||||
|
Mahshadin
Admin Group
Joined: January 26 2006 Location: United States Status: Offline Points: 3882 |
Post Options
Thanks(0)
Quote Reply
Posted: July 21 2012 at 10:01am |
|||||||||||||||||||||||||||||||||||||||||||||||||||||||||||||||||||||||||||||||||||||||||||||||||||||||||||||||||||||||||||||||||||||||||||||||||||||||||||||||||||||||||||||||||||||||||||||||||||||||||||||||||||||||||||||||||||||||||||||||||||||||||||||||||||||||||||||||||||||||||||||||||||||||||||||||||||||||||||||||||||
|
Elver
Its easy to blame others for our own problems, and I do agree with you on the waste from the Colorado River Project as I live in Phoenix Az which entirely dependant on the Coloado Water system for Water and I see much waste here as people who come here want the same green environment their accustomed to from wherever they came from. There are whole sections of the city that are still based on a flooding irrigation system which is just absurd, just so they can have nice green grass in a desert that can not support it (Crazy). Hers the thing The colorado Water Reclamation Project is based on a gravity and stratically placed dams, resevours, and duct systems. The water California uses has nothing to do with Colorado water availablity as you are Up the hill so-da-speak. If you drained all the pools and turned off the water to LA your situation would not change in the slightest bit as that water would drain off as it always has based on gravity. And on top of that thinking that the water stored in this system should some how be pumped back up the hill to Colorado is just not feasable cost wise, if they tried to do this your water costs would quadrouple overnight. Colorado has been fortinate as Mother Nature controls your water system with rain and mostly snow pack in the many mountains and natural systems the state is blessed with. If the climate (Drought) keeps progressing in your state Colorado may need to consider larger and a more extensive storage system similar to the downhill states California, Arizona, Nevada, Utah, and others. Putting thins in perspective though, your comment about someones swimming pool in Vegas or LA are minor on the scale of total consuption. For all the water used by California through the Colorado Water System out of 10 gallons used almost 8 of those are used by Agriculture which produces much of the fresh produce for the Western United States. And of that it is estimated that out of those 8 2 are considered wasted or over used in current irrigation practices. Arizona where I live is in the same boat and actualy by percentage by far passes California in increasing Usage over the past 2 decades. If current conditions in Climate continue for an extended period of time many of the Downhill states will feel the effects as well and it will be much more severe as they are much more dependant on the system than your state is. It will just take a little longer to directly affect these states as they have planned ahead for many decades and have huge storage basins to accomiditae for shortlived droughts which come and go. Lets just hope that Mother NAture and the changing climate conditions are not long lived, as we seem to be stubbornly resistant in planning and spending the neccessar public money to address these problems accross the Country not just in your state. These type of solutions take years and even decades to be planned, built, and come online. We have become to short sighted in this Country not only in planning for Water, but also Energy, and other critical subjects that need to be addressed long term not on a 2 year election cycle. |
||||||||||||||||||||||||||||||||||||||||||||||||||||||||||||||||||||||||||||||||||||||||||||||||||||||||||||||||||||||||||||||||||||||||||||||||||||||||||||||||||||||||||||||||||||||||||||||||||||||||||||||||||||||||||||||||||||||||||||||||||||||||||||||||||||||||||||||||||||||||||||||||||||||||||||||||||||||||||||||||||||
|
"In a time of universal deceit, telling the truth is a revolutionary act." G Orwell
|
||||||||||||||||||||||||||||||||||||||||||||||||||||||||||||||||||||||||||||||||||||||||||||||||||||||||||||||||||||||||||||||||||||||||||||||||||||||||||||||||||||||||||||||||||||||||||||||||||||||||||||||||||||||||||||||||||||||||||||||||||||||||||||||||||||||||||||||||||||||||||||||||||||||||||||||||||||||||||||||||||||
|
||||||||||||||||||||||||||||||||||||||||||||||||||||||||||||||||||||||||||||||||||||||||||||||||||||||||||||||||||||||||||||||||||||||||||||||||||||||||||||||||||||||||||||||||||||||||||||||||||||||||||||||||||||||||||||||||||||||||||||||||||||||||||||||||||||||||||||||||||||||||||||||||||||||||||||||||||||||||||||||||||||
|
Elver
Valued Member
Joined: June 14 2008 Status: Offline Points: 7778 |
Post Options
Thanks(0)
Quote Reply
Posted: July 20 2012 at 9:20pm |
|||||||||||||||||||||||||||||||||||||||||||||||||||||||||||||||||||||||||||||||||||||||||||||||||||||||||||||||||||||||||||||||||||||||||||||||||||||||||||||||||||||||||||||||||||||||||||||||||||||||||||||||||||||||||||||||||||||||||||||||||||||||||||||||||||||||||||||||||||||||||||||||||||||||||||||||||||||||||||||||||||
|
The drought here in Colorado is very bad. Normally in the summer we get at least 2 bags, or more, of grass every week from mowing. This year we've only had to mow every other week & we don't even get half a bag. The grass simply isn't growing.
Interesting though is that they've only declared a level 2 drought season rather than level 3 or 4. We have different watering rules for each stage. This year we are prohibited from watering from 10:00 AM until 6:00 PM. They also don't want anyone watering more than twice a week. Yet, I bet all over California, they are still filling up those swimming pools & draining the Colorado river. Lake Mead is emptying fast, so Californian's will learn conservation too late. I really bothers me that our yards have to suffer while people in Vegas & LA are swimming in their pools all the time.
Water is going to be a major concern in the near future. Also, the Ogallala aquifer which irrigates the midwest is down 2/3rds from where it was years ago.
Plant more trees!
|
||||||||||||||||||||||||||||||||||||||||||||||||||||||||||||||||||||||||||||||||||||||||||||||||||||||||||||||||||||||||||||||||||||||||||||||||||||||||||||||||||||||||||||||||||||||||||||||||||||||||||||||||||||||||||||||||||||||||||||||||||||||||||||||||||||||||||||||||||||||||||||||||||||||||||||||||||||||||||||||||||||
|
Mahshadin
Admin Group
Joined: January 26 2006 Location: United States Status: Offline Points: 3882 |
Post Options
Thanks(0)
Quote Reply
Posted: July 20 2012 at 8:30am |
|||||||||||||||||||||||||||||||||||||||||||||||||||||||||||||||||||||||||||||||||||||||||||||||||||||||||||||||||||||||||||||||||||||||||||||||||||||||||||||||||||||||||||||||||||||||||||||||||||||||||||||||||||||||||||||||||||||||||||||||||||||||||||||||||||||||||||||||||||||||||||||||||||||||||||||||||||||||||||||||||||
|
Earth (The Operators Manual) By: Republican Scientist Select Link To View  |
||||||||||||||||||||||||||||||||||||||||||||||||||||||||||||||||||||||||||||||||||||||||||||||||||||||||||||||||||||||||||||||||||||||||||||||||||||||||||||||||||||||||||||||||||||||||||||||||||||||||||||||||||||||||||||||||||||||||||||||||||||||||||||||||||||||||||||||||||||||||||||||||||||||||||||||||||||||||||||||||||||
|
"In a time of universal deceit, telling the truth is a revolutionary act." G Orwell
|
||||||||||||||||||||||||||||||||||||||||||||||||||||||||||||||||||||||||||||||||||||||||||||||||||||||||||||||||||||||||||||||||||||||||||||||||||||||||||||||||||||||||||||||||||||||||||||||||||||||||||||||||||||||||||||||||||||||||||||||||||||||||||||||||||||||||||||||||||||||||||||||||||||||||||||||||||||||||||||||||||||
|
||||||||||||||||||||||||||||||||||||||||||||||||||||||||||||||||||||||||||||||||||||||||||||||||||||||||||||||||||||||||||||||||||||||||||||||||||||||||||||||||||||||||||||||||||||||||||||||||||||||||||||||||||||||||||||||||||||||||||||||||||||||||||||||||||||||||||||||||||||||||||||||||||||||||||||||||||||||||||||||||||||
|
Mahshadin
Admin Group
Joined: January 26 2006 Location: United States Status: Offline Points: 3882 |
Post Options
Thanks(0)
Quote Reply
Posted: July 15 2012 at 1:59pm |
|||||||||||||||||||||||||||||||||||||||||||||||||||||||||||||||||||||||||||||||||||||||||||||||||||||||||||||||||||||||||||||||||||||||||||||||||||||||||||||||||||||||||||||||||||||||||||||||||||||||||||||||||||||||||||||||||||||||||||||||||||||||||||||||||||||||||||||||||||||||||||||||||||||||||||||||||||||||||||||||||||
|
State of the Climate National Overview June 2012 National Oceanic and Atmospheric AdministrationNational Climatic Data CenterClimate Highlights June 2012
 For detailed info on regions select link below http://www.ncdc.noaa.gov/sotc/national/2012/6 |
||||||||||||||||||||||||||||||||||||||||||||||||||||||||||||||||||||||||||||||||||||||||||||||||||||||||||||||||||||||||||||||||||||||||||||||||||||||||||||||||||||||||||||||||||||||||||||||||||||||||||||||||||||||||||||||||||||||||||||||||||||||||||||||||||||||||||||||||||||||||||||||||||||||||||||||||||||||||||||||||||||
|
"In a time of universal deceit, telling the truth is a revolutionary act." G Orwell
|
||||||||||||||||||||||||||||||||||||||||||||||||||||||||||||||||||||||||||||||||||||||||||||||||||||||||||||||||||||||||||||||||||||||||||||||||||||||||||||||||||||||||||||||||||||||||||||||||||||||||||||||||||||||||||||||||||||||||||||||||||||||||||||||||||||||||||||||||||||||||||||||||||||||||||||||||||||||||||||||||||||
|
||||||||||||||||||||||||||||||||||||||||||||||||||||||||||||||||||||||||||||||||||||||||||||||||||||||||||||||||||||||||||||||||||||||||||||||||||||||||||||||||||||||||||||||||||||||||||||||||||||||||||||||||||||||||||||||||||||||||||||||||||||||||||||||||||||||||||||||||||||||||||||||||||||||||||||||||||||||||||||||||||||
|
Guests
Guest Group
|
Post Options
Thanks(0)
Quote Reply
Posted: July 07 2012 at 1:19pm |
|||||||||||||||||||||||||||||||||||||||||||||||||||||||||||||||||||||||||||||||||||||||||||||||||||||||||||||||||||||||||||||||||||||||||||||||||||||||||||||||||||||||||||||||||||||||||||||||||||||||||||||||||||||||||||||||||||||||||||||||||||||||||||||||||||||||||||||||||||||||||||||||||||||||||||||||||||||||||||||||||||
|
This is why I purchased enough wheat berries to make bread for two years or more if I ration. This drought could go on for a long time. I may be getting more water cubes.
|
||||||||||||||||||||||||||||||||||||||||||||||||||||||||||||||||||||||||||||||||||||||||||||||||||||||||||||||||||||||||||||||||||||||||||||||||||||||||||||||||||||||||||||||||||||||||||||||||||||||||||||||||||||||||||||||||||||||||||||||||||||||||||||||||||||||||||||||||||||||||||||||||||||||||||||||||||||||||||||||||||||
|
Mahshadin
Admin Group
Joined: January 26 2006 Location: United States Status: Offline Points: 3882 |
Post Options
Thanks(0)
Quote Reply
Posted: July 07 2012 at 12:24pm |
|||||||||||||||||||||||||||||||||||||||||||||||||||||||||||||||||||||||||||||||||||||||||||||||||||||||||||||||||||||||||||||||||||||||||||||||||||||||||||||||||||||||||||||||||||||||||||||||||||||||||||||||||||||||||||||||||||||||||||||||||||||||||||||||||||||||||||||||||||||||||||||||||||||||||||||||||||||||||||||||||||
|
More than half of the Country in Drought Conditions
 |
||||||||||||||||||||||||||||||||||||||||||||||||||||||||||||||||||||||||||||||||||||||||||||||||||||||||||||||||||||||||||||||||||||||||||||||||||||||||||||||||||||||||||||||||||||||||||||||||||||||||||||||||||||||||||||||||||||||||||||||||||||||||||||||||||||||||||||||||||||||||||||||||||||||||||||||||||||||||||||||||||||
|
"In a time of universal deceit, telling the truth is a revolutionary act." G Orwell
|
||||||||||||||||||||||||||||||||||||||||||||||||||||||||||||||||||||||||||||||||||||||||||||||||||||||||||||||||||||||||||||||||||||||||||||||||||||||||||||||||||||||||||||||||||||||||||||||||||||||||||||||||||||||||||||||||||||||||||||||||||||||||||||||||||||||||||||||||||||||||||||||||||||||||||||||||||||||||||||||||||||
|
||||||||||||||||||||||||||||||||||||||||||||||||||||||||||||||||||||||||||||||||||||||||||||||||||||||||||||||||||||||||||||||||||||||||||||||||||||||||||||||||||||||||||||||||||||||||||||||||||||||||||||||||||||||||||||||||||||||||||||||||||||||||||||||||||||||||||||||||||||||||||||||||||||||||||||||||||||||||||||||||||||
|
Mahshadin
Admin Group
Joined: January 26 2006 Location: United States Status: Offline Points: 3882 |
Post Options
Thanks(0)
Quote Reply
Posted: June 19 2012 at 10:37am |
|||||||||||||||||||||||||||||||||||||||||||||||||||||||||||||||||||||||||||||||||||||||||||||||||||||||||||||||||||||||||||||||||||||||||||||||||||||||||||||||||||||||||||||||||||||||||||||||||||||||||||||||||||||||||||||||||||||||||||||||||||||||||||||||||||||||||||||||||||||||||||||||||||||||||||||||||||||||||||||||||||
May 2012 global temperatures were second-warmest on recordMonth sets new mark for globally-averaged warmth over land surfaces The globally-averaged temperature for May 2012 marked the second warmest May since record keeping began in 1880. May 2012 also marks the 36th consecutive May and 327th consecutive month with a global temperature above the 20th century average. Most areas of the world experienced much warmer-than-average monthly temperatures, including nearly all of Europe, Asia, northern Africa, most of North America and southern Greenland. Only Australia, Alaska and parts of the western U.S.-Canadian border region were notably cooler than average. With the dissipation of La Nina in April, ocean conditions in May were "ENSO neutral". According to NOAA's Climate Prediction Center, there is a 50 percent chance that El Nino conditions will emerge during the second half of 2012. Global temperature highlights: May
May 2012 Blended Land & Sea Surface Temperature Anomalies in °C
Global temperature highlights: March-May
Year to Date 2012 Blended Land & Sea Surface Temperature Anomalies in °C
Polar sea ice and precipitation highlights: May
 Arctic and Antarctic sea ice extent, from the May 2012 Global Snow & Ice Report
Global temperature highlights: Year to Date
|
||||||||||||||||||||||||||||||||||||||||||||||||||||||||||||||||||||||||||||||||||||||||||||||||||||||||||||||||||||||||||||||||||||||||||||||||||||||||||||||||||||||||||||||||||||||||||||||||||||||||||||||||||||||||||||||||||||||||||||||||||||||||||||||||||||||||||||||||||||||||||||||||||||||||||||||||||||||||||||||||||||
|
"In a time of universal deceit, telling the truth is a revolutionary act." G Orwell
|
||||||||||||||||||||||||||||||||||||||||||||||||||||||||||||||||||||||||||||||||||||||||||||||||||||||||||||||||||||||||||||||||||||||||||||||||||||||||||||||||||||||||||||||||||||||||||||||||||||||||||||||||||||||||||||||||||||||||||||||||||||||||||||||||||||||||||||||||||||||||||||||||||||||||||||||||||||||||||||||||||||
|
||||||||||||||||||||||||||||||||||||||||||||||||||||||||||||||||||||||||||||||||||||||||||||||||||||||||||||||||||||||||||||||||||||||||||||||||||||||||||||||||||||||||||||||||||||||||||||||||||||||||||||||||||||||||||||||||||||||||||||||||||||||||||||||||||||||||||||||||||||||||||||||||||||||||||||||||||||||||||||||||||||
|
Mahshadin
Admin Group
Joined: January 26 2006 Location: United States Status: Offline Points: 3882 |
Post Options
Thanks(0)
Quote Reply
Posted: June 15 2012 at 12:48pm |
|||||||||||||||||||||||||||||||||||||||||||||||||||||||||||||||||||||||||||||||||||||||||||||||||||||||||||||||||||||||||||||||||||||||||||||||||||||||||||||||||||||||||||||||||||||||||||||||||||||||||||||||||||||||||||||||||||||||||||||||||||||||||||||||||||||||||||||||||||||||||||||||||||||||||||||||||||||||||||||||||||
U.S. experiences second warmest May, hottest spring on recordLower 48 also experienced record warm year-to-date and twelve-month periods The average temperature for the contiguous U.S. during May was 64.3F, 3.3F above the long-term average, making it the second warmest May on record. The month's high temperatures also contributed to the warmest spring, warmest year-to-date, and warmest 12-month period the nation has experienced since recordkeeping began in 1895. The spring season's (March-May) nationally-averaged temperature was 57.1F, 5.2�F above the 1901-2000 long-term average, surpassing the previous warmest spring (1910) by 2.0F. Precipitation totals across the country were mixed during May, with the nation as a whole being drier than average. The nationally-averaged precipitation total of 2.51 inches was 0.36 inch below average. The coastal Southeast received some drought relief when Tropical Storm Beryl brought heavy rains to the region late in the month. Note: The May/Spring Monthly Climate Report for the United States has several pages of supplemental information and data regarding some of the exceptional events from the month and season.
U.S. climate highlights - May
U.S. climate highlights - Spring (March-May)
U.S. climate highlights Year-to-date
12-month period (June 2011 - May 2012)
The ten warmest 12-month periods of the U.S. record. Click to enlarge, or click here for expanded information. |
||||||||||||||||||||||||||||||||||||||||||||||||||||||||||||||||||||||||||||||||||||||||||||||||||||||||||||||||||||||||||||||||||||||||||||||||||||||||||||||||||||||||||||||||||||||||||||||||||||||||||||||||||||||||||||||||||||||||||||||||||||||||||||||||||||||||||||||||||||||||||||||||||||||||||||||||||||||||||||||||||||
|
"In a time of universal deceit, telling the truth is a revolutionary act." G Orwell
|
||||||||||||||||||||||||||||||||||||||||||||||||||||||||||||||||||||||||||||||||||||||||||||||||||||||||||||||||||||||||||||||||||||||||||||||||||||||||||||||||||||||||||||||||||||||||||||||||||||||||||||||||||||||||||||||||||||||||||||||||||||||||||||||||||||||||||||||||||||||||||||||||||||||||||||||||||||||||||||||||||||
|
||||||||||||||||||||||||||||||||||||||||||||||||||||||||||||||||||||||||||||||||||||||||||||||||||||||||||||||||||||||||||||||||||||||||||||||||||||||||||||||||||||||||||||||||||||||||||||||||||||||||||||||||||||||||||||||||||||||||||||||||||||||||||||||||||||||||||||||||||||||||||||||||||||||||||||||||||||||||||||||||||||
|
Mahshadin
Admin Group
Joined: January 26 2006 Location: United States Status: Offline Points: 3882 |
Post Options
Thanks(0)
Quote Reply
Posted: June 07 2012 at 1:01pm |
|||||||||||||||||||||||||||||||||||||||||||||||||||||||||||||||||||||||||||||||||||||||||||||||||||||||||||||||||||||||||||||||||||||||||||||||||||||||||||||||||||||||||||||||||||||||||||||||||||||||||||||||||||||||||||||||||||||||||||||||||||||||||||||||||||||||||||||||||||||||||||||||||||||||||||||||||||||||||||||||||||
Is Humanity Pushing Earth Past a Tipping Point?
By Brandon
Keim June 6, 2012 |
5:23 pm |
Could human activity push Earth's biological systems to a planet-wide tipping point, causing changes as radical as the Ice Age's end - but with less pleasant results, and with billions of people along for a bumpy ride? It's by no means a settled scientific proposition, but many researchers say it's worth considering - and not just as an apocalyptic warning or far-fetched speculation, but as a legitimate question raised by emerging science. "There are some biological realities we can�t ignore," said paleoecologist Anthony Barnosky of the University of California, Berkeley. "What I'd like to avoid is getting caught by surprise."
In "Approaching a state shift in Earth�s biosphere," published June 6 in Nature, Barnosky and 21 co-authors cite 100 papers in summarizing what�s known about environmental tipping points. While the concept was popularized by Malcolm Gladwell's accounts of sudden, widespread changes in society, the underlying mathematics - which won physicist Kenneth Wilson a Nobel Prize in 1982 - have far-reaching implications. In the last few decades, scientists have found tipping behaviors in various natural environments, from locale-scale ponds and coral reefs to regional systems like the Sahara desert, which until 5,500 years ago was a fertile grassland, and perhaps even the Amazon basin. Deforestation in the Amazon jungle, which some scientists say could become a savannah. Image: NASA Common to these examples is a type of transformation not described in traditional ideas of nature as existing in a static balance, with change occurring gradually. Instead, the systems seem to be dynamic, ebbing and flowing within a range of biological parameters. Stress those parameters - with fast-rising temperatures, say, or a burst of nutrients - and systems are capable of sudden, feedback loop-fueled reconfiguration. According to some researchers, that�s what happened when life�s diversity exploded in an eyeblink 540 million years ago, or much more recently when a glacier-chilled Earth became in a couple thousand years the temperate garden that cradled human civilization. But while the Cambrian explosion and Holocene warming were sparked by natural, planet-wide changes to ocean chemistry and solar intensity, say Barnosky and colleagues, there's a new force to consider: 7 billion people who exert a combined influence usually associated with planetary processes. Human activity now dominates 43 percent of Earth�s land surface and affects twice that area. One-third of all available fresh water is diverted to human use. A full 20 percent of Earth�s net terrestrial primary production, the sheer volume of life produced on land every year, is harvested for human purposes. Extinction rates compare to those recorded during the demise of dinosaurs and average temperatures will likely be higher in 2070 than at any point in human evolution. Scientists informally call our current geological age the "Anthropocene," and to Barnosky's group this means we're strong enough to tip the planet, radically changing regional climates and ecologies. "Everything that happened the last time around is happening now, only more of it," said Barnosky of the last ice age's end and ongoing changes to Earth's climate and biosphere. "I think the evidence makes it pretty clear that another critical transition or tipping point is very plausible within the next century." Yet while Barnosky and colleagues write that the plausibility of a planetary shift is high, they say "considerable uncertainty remains about whether it is inevitable and, if so, how far in the future it may be." Other scientists echoed the caution. "We have quite good evidence for the Earth having tipping elements. They can be very small, like a pond, or large like a monsoon system. Those we understand very well. But the bigger ones are harder to understand," said ecologist Marten Scheffer of Wageningen University, a tipping point research pioneer. Scheffer said he is "not so convinced" that a single, Earth-wide shift is imminent. 'There have been big, planetary shifts before. We can
see it coming. That's the difference.' In contrast, ecologist Aaron Ellison
of Harvard University, who studies the dynamics of tipping points, said the new
paper "states the obvious. We're in a rapidly changing world and things are
happening really quickly."
One important aspect of the new review, said ecologist Steve Carpenter of the University of Wisconsin, is its focus on changing land use patterns. Most historical large-scale tips were apparently driven by changes in Earth's biogeochemistry, such as the bacterial oxygenation of primeval seas that afterwards could support multicellular life. But humans are rapidly changing local species compositions and ecosystem functions, causing small-scale changes that could combine and cascade into planet-wide shifts. Brad Cardinale, an ecologist at the University of Wisconsin, said the science is suggestive but still not conclusive, likening the trajectory of research to that followed by chaos theory in the late 20th century. "We discovered in mathematical models that chaos should exist and, if it did, it would have major implications for our ability to predict ecological changes on the planet. A few empirical case studies emerged to suggest chaos actually occurs in ecosystems. But the interpretation of some of these was controversial, and subsequent studies ultimately failed to show that chaos was the generality," he said. Continued Cardinale, "Ten years from now, the Barnosky et al. paper will have one of two fates. We'll either look back and think this was a visionary warning about how people are changing the planet. Or we'll look back and say that state shifts was a 'sexy' idea that was over-sold and didn�t pan out. Only time will tell." The pressing question, then, is one of risk analysis: Given incomplete but troubling information, what should people do? Barnosky and colleagues call for innovations and changes - more-efficient food production, fossil fuel alternatives, better ecosystem management and reduced population growth. Ellison hopes some disruptive change will cause a tipping point in human sustainability. "These are admittedly huge tasks, but are vital if the goal of science and society is to steer the biosphere towards conditions we desire, rather than those that are thrust upon us unwittingly," wrote Barnosky and colleagues. "There have been big, planetary shifts before," Barnosky said. "We can see it coming. That's the difference. The dinosaurs couldn't see it coming." |
||||||||||||||||||||||||||||||||||||||||||||||||||||||||||||||||||||||||||||||||||||||||||||||||||||||||||||||||||||||||||||||||||||||||||||||||||||||||||||||||||||||||||||||||||||||||||||||||||||||||||||||||||||||||||||||||||||||||||||||||||||||||||||||||||||||||||||||||||||||||||||||||||||||||||||||||||||||||||||||||||||
|
"In a time of universal deceit, telling the truth is a revolutionary act." G Orwell
|
||||||||||||||||||||||||||||||||||||||||||||||||||||||||||||||||||||||||||||||||||||||||||||||||||||||||||||||||||||||||||||||||||||||||||||||||||||||||||||||||||||||||||||||||||||||||||||||||||||||||||||||||||||||||||||||||||||||||||||||||||||||||||||||||||||||||||||||||||||||||||||||||||||||||||||||||||||||||||||||||||||
|
||||||||||||||||||||||||||||||||||||||||||||||||||||||||||||||||||||||||||||||||||||||||||||||||||||||||||||||||||||||||||||||||||||||||||||||||||||||||||||||||||||||||||||||||||||||||||||||||||||||||||||||||||||||||||||||||||||||||||||||||||||||||||||||||||||||||||||||||||||||||||||||||||||||||||||||||||||||||||||||||||||
|
Mahshadin
Admin Group
Joined: January 26 2006 Location: United States Status: Offline Points: 3882 |
Post Options
Thanks(0)
Quote Reply
Posted: May 26 2012 at 9:09am |
|||||||||||||||||||||||||||||||||||||||||||||||||||||||||||||||||||||||||||||||||||||||||||||||||||||||||||||||||||||||||||||||||||||||||||||||||||||||||||||||||||||||||||||||||||||||||||||||||||||||||||||||||||||||||||||||||||||||||||||||||||||||||||||||||||||||||||||||||||||||||||||||||||||||||||||||||||||||||||||||||||
|
April Global Temperatures Are Fifth Warmest State of the Climate |
||||||||||||||||||||||||||||||||||||||||||||||||||||||||||||||||||||||||||||||||||||||||||||||||||||||||||||||||||||||||||||||||||||||||||||||||||||||||||||||||||||||||||||||||||||||||||||||||||||||||||||||||||||||||||||||||||||||||||||||||||||||||||||||||||||||||||||||||||||||||||||||||||||||||||||||||||||||||||||||||||||
| April | Anomaly | Rank (out of 133 years) | Records | |||
|---|---|---|---|---|---|---|
| C | F | Year(s) | C | F | ||
| Global | ||||||
| Land | +1.39 +/- 0.11 | +2.50 +/- 0.20 | 2nd Warmest | Warmest: 2007 | +1.44 | +2.59 |
| 132nd Coolest | Coolest: 1905 | -0.79 | -1.42 | |||
| Ocean | +0.38 +/- 0.04 | +0.68 +/- 0.07 | 11th Warmest | Warmest: 1998, 2010 | +0.56 | +1.01 |
| 123rd Coolest | Coolest: 1911 | -0.53 | -0.95 | |||
| Ties: 2011 | ||||||
| Land and Ocean | +0.65 +/- 0.08 | +1.17 +/- 0.14 | 5th Warmest | Warmest: 2010 | +0.75 | +1.35 |
| 129th Coolest | Coolest: 1909 | -0.52 | -0.94 | |||
| Northern Hemisphere | ||||||
| Land | +1.74 +/- 0.14 | +3.13 +/- 0.25 | 1st Warmest | Warmest: 2000* | +1.62* | +2.92* |
| 133rd Coolest | Coolest: 1905 | -1.05 | -1.89 | |||
| Ocean | +0.37 +/- 0.04 | +0.67 +/- 0.07 | 9th Warmest | Warmest: 2010 | +0.59 | +1.06 |
| 125th Coolest | Coolest: 1911 | -0.52 | -0.94 | |||
| Ties: 2001 | ||||||
| Land and Ocean | +0.89 +/- 0.11 | +1.60 +/- 0.20 | 1st Warmest | Warmest: 2007+, 2010+ | +0.87+ | +1.57+ |
| 133rd Coolest | Coolest: 1909 | -0.59 | -1.06 | |||
| Southern Hemisphere | ||||||
| Land | +0.47 +/- 0.14 | +0.85 +/- 0.25 | 23rd Warmest | Warmest: 2005, 2007 | +1.07 | +1.93 |
| 111st Coolest | Coolest: 1917 | -0.76 | -1.37 | |||
| Ties: 2011 | ||||||
| Ocean | +0.41 +/- 0.05 | +0.74 +/- 0.09 | 14th Warmest | Warmest: 1998 | +0.61 | +1.10 |
| 120th Coolest | Coolest: 1911 | -0.52 | -0.94 | |||
| Land and Ocean | +0.42 +/- 0.06 | +0.76 +/- 0.11 | 16th Warmest | Warmest: 1998 | +0.66 | +1.19 |
| 118th Coolest | Coolest: 1911 | -0.52 | -0.94 | |||
| Ties: 1990, 1991 | ||||||
* Please note that the value depicted as record year (2000) for the Northern Hemisphere land is the second warmest year on record.
+ Please note that the value depicted as record year (2007 and 2010) for the Northern Hemisphere land and ocean tie for the second warmest year on record.


The January�April map of temperature anomalies shows that warmer-than-average temperatures occurred across the contiguous United States, southern Canada, Mexico, southern South America, the United Kingdom, Scandinavia, northern Russia, and parts of southeastern Asia. Cooler-than-average conditions were observed across Alaska, northern Africa, central Asia, eastern Russia, and most of Australia.
The globally-averaged land and ocean temperature for January�April 2012 was 0.46�C (0.83�F) above the 20th century average of 12.6C (54.8F), the coolest such period since 2008 and the 15th warmest such period in the 133-year record. The land-only global average temperature anomaly of 0.75C (1.35F) above the 20th century average of 4.8C (40.5F) ties with 2011 as the 17th warmest such period and was the coolest such period since 1997. Meanwhile, the global ocean temperature tied with 1999 as the 13th warmest such period, with an anomaly of 0.35C (0.63F) above the 20th century average of 15.9C (60.7F)�the coolest January�April anomaly since 2008.
| January�April | Anomaly | Rank (out of 133 years) | Records | |||
|---|---|---|---|---|---|---|
| C | F | Year(s) | C | F | ||
| Global | ||||||
| Land | +0.75 +/- 0.22 | +1.35 +/- 0.40 | 17th Warmest | Warmest: 2007 | +1.38 | +2.48 |
| 117th Coolest | Coolest: 1893 | -1.04 | -1.87 | |||
| Ties: 2011 | ||||||
| Ocean | +0.35 +/- 0.04 | +0.63 +/- 0.07 | 13th Warmest | Warmest: 1998, 2010 | +0.56 | +1.01 |
| 121st Coolest | Coolest: 1911 | -0.51 | -0.92 | |||
| Ties: 1999 | ||||||
| Land and Ocean | +0.46 +/- 0.09 | +0.83 +/- 0.16 | 15th Warmest | Warmest: 2010 | +0.71 | +1.28 |
| 119th Coolest | Coolest: 1911 | -0.53 | -0.95 | |||
| Northern Hemisphere | ||||||
| Land | +0.87 +/- 0.26 | +1.57 +/- 0.47 | 18th Warmest | Warmest: 2007 | +1.58 | +2.84 |
| 116th Coolest | Coolest: 1893 | -1.25 | -2.25 | |||
| Ocean | +0.32 +/- 0.05 | +0.58 +/- 0.09 | 13th Warmest | Warmest: 2010 | +0.55 | +0.99 |
| 121st Coolest | Coolest: 1904, 1908, 1911 | -0.46 | -0.83 | |||
| Land and Ocean | +0.53 +/- 0.14 | +0.95 +/- 0.25 | 16th Warmest | Warmest: 2007 | +0.89 | +1.60 |
| 118th Coolest | Coolest: 1893 | -0.71 | -1.28 | |||
| Ties: 2008 | ||||||
| Southern Hemisphere | ||||||
| Land | +0.43 +/- 0.14 | +0.77 +/- 0.25 | 22nd Warmest | Warmest: 2010 | +1.02 | +1.84 |
| 112nd Coolest | Coolest: 1917 | -0.80 | -1.44 | |||
| Ties: 1969 | ||||||
| Ocean | +0.38 +/- 0.04 | +0.68 +/- 0.07 | 15th Warmest | Warmest: 1998 | +0.60 | +1.08 |
| 119th Coolest | Coolest: 1911 | -0.53 | -0.95 | |||
| Ties: 2000 | ||||||
| Land and Ocean | +0.39 +/- 0.07 | +0.70 +/- 0.13 | 17th Warmest | Warmest: 1998 | +0.65 | +1.17 |
| 117th Coolest | Coolest: 1911 | -0.54 | -0.97 | |||
| Ties: 1973 | ||||||


The maps below represent anomaly values based on the GHCN version 2 dataset of land surface stations using a base period of 1961�1990. During April 2012, above-average precipitation fell over areas that included the central and northwestern United States, and parts of northern and southern South America, Europe, and eastern Asia. Drier-than-average conditions were present across the eastern United States, the Hawaiian Islands, eastern Brazil, and southern parts of South America, and Australia.
Post Options
Thanks(0)
Quote Reply
Posted: May 08 2012 at 7:22pmPast 12 months and first third of the year were warmest nation has experienced
Several warm periods across the contiguous U.S. during April brought the national average temperature to 55F, 3.6F above average, marking the third warmest April on record. These temperatures, when added with the first quarter and previous 11 months, calculate to the warmest year-to-date and 12-month periods since recordkeeping began in 1895.
The 12-month period of May 2011-April 2012 has a nationally-averaged temperature 2.8F above the 1901-2000 long-term average, while the January-April 2012 months were 45.4F, 5.4F above the long-term average.
On the heels of the warmest March for the U.S., warmer and drier than average temperatures continued for much of the nation with some states in the Ohio Valley having a small, but still above average, dip in temperatures.
Note: The April 2012 Monthly Climate Report for the United States has several pages of supplemental information and data regarding the unprecedented early 2012 temperatures.
Warmer-than-average temperatures were present for a large portion of the nation during April with nine states in the Central and Northeast regions having April temperatures ranking among their ten warmest. Above-average temperatures were also present for the Southeast, Upper Midwest and much of the West.
Eight states - Illinois, Indiana, Kentucky, Michigan, Wisconsin, Ohio, Pennsylvania, and West Virginia - had average April temperatures cooler than their March temperatures. However, these temperatures were still above the long-term average for the month.
Statewide precipitation totals were mixed during April, with wetter than average conditions across the West Coast and Northern and Central Plains. Drier than average conditions were present in Texas and along the Gulf Coast, stretching northward toward the Great Lakes. The national precipitation average was 2.23 inches, 0.20 inch below average.
According to the Rutgers Global Snow Lab, the April snow cover extent across the contiguous United States was the third smallest on record, despite the late season Nor'easter which impacted the Northeast with snow near the end of April.
January-April was the warmest such period on record for the contiguous United States, with an average temperature of 45.4F, 5.4F above the long-term average. Twenty-six states, all east of the Rockies, were record warm for the four-month period and an additional 17 states had temperatures for the period among their ten warmest.

The first four months of 2012 were drier than average for the contiguous United States as a whole, with some regional variability. The eastern third of the nation was drier than average, with Maryland and Delaware record dry, and an additional six states had precipitation totals ranking among the ten driest. Drier than average conditions were also present for much of the Interior West.
Wetter than average conditions occurred across the central regions of the country and the Pacific Northwest, where above average precipitation contributed to higher than normal mountain snowpack at the end of the snow season. The amount of snowpack in the springtime is important in determining water supply for the region for the upcoming summer period.
According to the U.S. Drought Monitor, as of May 1st, 38.2 percent of the contiguous United States was experiencing drought conditions, an increase from the 31.9 percent at the beginning of 2012. Drought worsened across the Northeast, Southeast, and the Interior West while beneficial precipitation significantly improved drought conditions across the Southern Plains and western Gulf of Mexico.
The U.S. Climate Extremes Index (USCEI), an index that tracks the highest and lowest 10 percent of extremes in temperature, precipitation, drought and tropical cyclones across the contiguous U.S., was a record 42 percent during the January-April period, over twice the average value. Extremes in warm daytime temperatures (82 percent) and warm nighttime temperatures (68 percent) covered a large area of the nation, contributing to the record high value.
http://www.ncdc.noaa.gov/sotc/summary-info/national/2012/4
Post Options
Thanks(0)
Quote Reply
Posted: May 03 2012 at 4:05pmKey database monitoring climate change received its one-millionth report from a network of "citizen scientists"
 Lucille Tower submitted the one-millionth observation; here, she examines a vine maple. |
May 3, 2012
On April 30, 2012, the USA National Phenology Network (NPN), partially funded by the National Science Foundation (NSF), received its one-millionth nature observation from volunteers--many of whom are non-scientists or "citizen scientists." The observation will help understand the impacts of climate change on Earth's plants and animals.
Scientists and citizen volunteers contribute individual bits of data to NPN daily concerning phenology, the study of the timing of plant and animal responses--such as leafing, flowering, nesting, foliage changes, hibernation and migration--to seasonal changes.
Resource managers combine the data into an increasingly detailed record of how Earth's climate is evolving and how it might affect humans and Mother Nature down the road.
Hitting the one-millionth observation is exciting because researchers and decision-makers need more information to understand and respond to our rapidly changing planet," said Jake Weltzin, a U.S. Geological Survey scientist and executive director of NPN. "More information means better-informed decisions that ensure the continued vitality of our natural areas that we all depend on--and enjoy."
One millionth observation
Watching and reporting the flowering of a nearby vine maple, Acer circinatum, turned into the millionth observation submitted through NPN's online observation program, Nature's Notebook. Lucille Tower, an amateur scientist from Portland, Ore. submitted the record.
"Tower responded "yes" to the question on the NPN's observation submission form: "Did you see: One or more fresh open or unopened flowers or flower buds visible in the plant?" The record marked a precisely defined point in the life cycle of the vine maple, something that researchers observe while monitoring how climate change affects the start and end point of a plant's viability.
"We're excited about the quantity of observations and what it means for potentially answering the big questions," said Alyssa Rosemartin, NPN's assistant director.
"Our first records in the contemporary system are from Erin Lindquist, a professor at Meredith College, whose students collected thousands of records on deciduous tree phenology in North Carolina in the fall of 2008, and the millionth was submitted by a participant in Portland Budwatch, one of our partners that has set up several phenology trails and trained 100 observers in Portland. Look how far we've come."
Societal and economic benefits
The NPN provides a myriad of societal benefits by, for example, supporting the development of more accurate forecasts of the onset of allergy seasons; the spread of vector-borne diseases, such as lyme disease and West Nile virus; the movements of invasive plants; the development of drought conditions--information that could be used to help improve the health and welfare of large human populations, contribute to the management of water resources, wildlife and working farms and ranches, and maintain the vitality of ecosystems.
Weltzin says the NPN database also supports analyses of climate-change impacts that have important potential economic implications. Several examples:
Increasing the application of nature observations to economic analyses is a goal of the NPN, and citizen scientists have more than been up to the job. "Depending on the task at hand, trained non-scientists can produce data that is just as reliable as data produced by (professional) scientists," said Weltzin.
Steps in the journey
In addition to producing high quality data, armies of NPN volunteers also produce a high quantity of data. The NPN typically receives between 2,000 and 3,000 nature observations per day-most of which would otherwise be unobtainable.
Weltzin said that each and every one of these observations is important because they help fill a hole in our knowledge base. Moreover, a single observation can be analyzed in tandem with other observations to help create the big picture of how a particular species is responding to climate changes.
Suppose, for example, that several volunteers in a certain geographic area each alert the NPN as to the first bloom date of a dogwood tree in the spring. Those individual observations could then be analyzed as a group to determine the pattern of dogwood blooms in the area.
"So much of our improved understanding about global environmental changes is driven by varied and valuable sources of information that include ambitious networks of citizen-scientists," said John Wingfield, NSF assistant director for Biological Sciences. "Knowledge gained from their dedicated work will continue to have a lasting effect on how we understand regularly recurring biological phenomena for hundreds of plant and animal species and collectively, they contribute to the policy arena."
Changing seasons
Changes in phenology are among the most sensitive biological indicators of global change. Across the world, many springtime events are occurring earlier--and fall events happening later--than in the past. Plants and animals are responding to these changes in different ways and at different speeds. These varying responses can be damaging to the life-sustaining relationships among creatures that have been dynamically stable for thousands of years.
For example, some wildflowers that migratory hummingbirds look for when they arrive in their summer habitats are flowering earlier--even before the hummingbirds arrive. The resulting missed opportunity with the flowers can deprive the birds of an important food source. If the trend continues, populations of hummingbirds and wildflowers could precipitously decline. In addition, some birds now remain year-round in their summer habitats instead of flying south for the winter.
Because of these types of changes, scientists need more and improved information about the pace and pattern of nature--locally to nationally--to answer important scientific and societal questions and to build the tools and models needed to help people understand and adapt to the changes at hand.
Individuals of all ages, from school children to retirees, as well as entire classes and community groups, are invited to join the NPN "army" of citizen scientists; no minimal level of commitment is required. Some volunteers submit their observations on a regular basis while others contribute occasionally, or even contribute valuable archived "shoeboxed" records that, when possible, are added to the NPN database to support analyses of long-term trends.
What could be in it for you?
Weltzin said that volunteers contribute to the NPN for varied reasons, including the opportunity to:
| -- | Lily Whiteman |
Investigators
Susan Mazer
Jake Weltzin
Mark Schwartz
Become an official participant and set your username and password. All you need is an email address and Internet access.
4. Log in to Nature's Notebook
Now you are ready to register your site and the plants and animals you will observe, and start reporting! As you collect data during the season, log in to your account at "Nature's Notebook" and enter your observations.
Once you've submitted your observations, you can explore your data on the dynamic visualization tool and check out your standing on the leaderboards.
Post Options
Thanks(0)
Quote Reply
Posted: April 30 2012 at 11:38am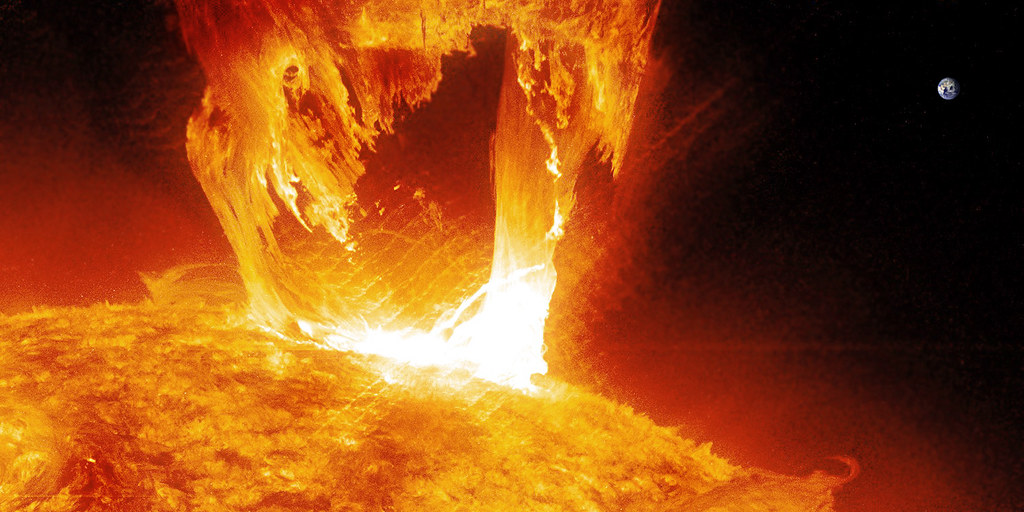
Do solar storms cause heat waves on Earth?
Although solar flares, and associated coronal mass ejections, can bombard Earth's outermost atmosphere with tremendous amounts of energy, most of that energy is reflected back into space by the Earth's magnetic field. Because the energy does not reach our planet's surface, it has no measurable influence on surface temperature.
The heat wave that affected the eastern and central United States in March 2012 coincided with a flurry of solar eruptions, and it's not unreasonable to wonder if such events are related. After all, the Sun's energy is the source of Earth's warmth.
But most of the energy released by solar storms like those on March 8-10 is not like the visible and ultraviolet light that penetrates Earth's atmosphere and warms the surface. Instead, solar storms hurl bursts of electrically charged particles through space, and the particles aimed at the Earth encounter our planet's magnetic field and upper atmosphere, the thermosphere.
The stream of energetic particles warms the thermosphere. Carbon dioxide and nitrogen oxide, coolants in the thermosphere, absorb the energy and then re-radiate heat back into space. A small fraction of the extra heat from the solar flare radiates to layers of the atmosphere below the thermosphere, but it is miniscule compared to the normal amount of heating the lower layers of the atmosphere already experience from incoming visible and ultraviolet sunlight.
Solar flares don't cause heat waves, but they do have other impacts on Earth. Consequences include pretty auroras, as well as hazards. They can rain extra radiation on satellites, and increase the drag on satellites in low-Earth orbit. Increased electromagnetic activity due to solar storms can also disrupt power grids and radio communications. Passengers on commercial jets flying polar routes may be exposed to increased electromagnetic radiation.
Short-lived solar explosions don't influence weather events like the March 2012 heat wave, but longer-term variations in solar output might affect Earth's climate. The latter half of the seventeenth century experienced a decades-long stretch of minimal solar activity known as the Maunder Minimum, which many scientists suspect may have triggered the Little Ice Age-a cold spell that chilled the Northern Hemisphere from about 1650 to 1850.
Over the long term, however, multiple records indicate that the amount of energy the Earth receives from the Sun is quite stable. Astronomers have aimed telescopes at the Sun since the Scientific Revolution, and recent studies have reconstructed solar activity over the past three centuries. Satellites have observed the Sun since 1978, and found that solar activity varies on a roughly 11-year cycle by about one-tenth of one percent.
As for the solar storm in early March 2012, it released a substantial amount of energy, but almost all of it was re-radiated back into space, and very little penetrated the lower atmosphere. Martin Mlynczak, associate principal investigator for NASA's Sounding of the Atmosphere using Broadband Emission Radiometry (SABER) instrument, says, "The extra energy from this storm is on the order of 100,000 times less than the energy we normally get at the Earth's surface. It's so small that you wouldn't even notice it."
http://www.climatewatch.noaa.gov/article/2012/do-solar-storms-cause-heat-waves-on-earth
_______________________________________________________________________________________________________
Post Options
Thanks(0)
Quote Reply
Posted: April 25 2012 at 7:31am
For some industries, the weather plays a significant role in determining revenue. Unexpected weather events can often cause significant financial losses. For instance, a drought can yield a severe impact on an agribusiness amount and quality of produce; unseasonably mild winters can similarly diminish the profit margins of utility companies. So, how can companies - particularly those at the mercy of Mother Nature - protect themselves against the elements and limit their exposure to financial risk?
Increasingly, companies have been managing weather risk by using derivatives, which provide the means for businesses to protect themselves against adverse financial affects that are due to variations in climate. According to industry body, the Weather Risk Management Association, trading volume of weather derivatives in 2010-2011 increased by 20 percent on the previous year.
Derivative contracts generally represent a contract to trade a specified quantity of an underlying asset, at an agreed price and time. By making a payment to a separate company that will assume the financial weather risk for them, organizations are buying a type of insurance: the company assuming the risk will pay the purchaser a pre-set amount of money that will correspond to the loss or cost increase caused by the disruptive weather. As such, risk exposure can be managed in a wide range of settings.
Weather derivatives derive their value from climatic conditions such as temperature, snowfall, hurricanes or rainfall. An important set of contracts traded at CME Group are temperature-based futures contracts. Contracts are offered for trade based on the temperature across a range of U.S., European and Australian cities such as Brisbane, Sydney and Melbourne.
The most common of these contracts come in the form of either Heating Degree Day (HDD) or Cooling Degree Day (CDD) contracts. The payoff of these contracts is based on the cumulated difference in daily temperatures relative to 18�C (about 64�F) over a fixed period such as a month. The fixed level of 18�C is the temperature at which the energy sector believes little heating or cooling occurs in households. The buyer of a HDD or CDD contract benefits from a positive payoff if cumulative temperature is below or above a specified level. While this nomenclature may seem counter-intuitive, heating (or cooling) occurs when temperatures are lower (higher).
Major participants in this market include utilities and insurance companies, whose costs and or revenues are dependent upon weather conditions. In an Australian setting, an electricity supplier normally provides its customers with electricity at a fixed price irrespective of the wholesale price in the National Electricity Market. However, the wholesale price of electricity can fluctuate wildly with extreme weather conditions. CDD contracts can provide a hedging tool for such fluctuations in electricity prices in the wholesale market during periods of extremely high temperatures. Similar arguments apply in the northern hemisphere, where utilities face risk from increased demand during periods of low temperatures and hence HDD contracts are a natural hedging tool.
Futures on traditional assets such as stocks, bonds, agricultural and most energy products are priced under the cost of carry approach. The logic of this approach is that there are two alternatives for obtaining the asset in question at some point in the future. These are either, borrow to purchase it now and store the asset, or agree to purchase the asset at that later date via a futures contract. Under the absence of arbitrage, the cost of both approaches should be equivalent. Hence the current cost of a futures contract is related to the current price of the asset and the cost of borrowing and storing the asset. This arbitrage-free valuation approach is a simple yet common method for pricing many financial securities.
Weather derivatives have also gained research attention in academic circles as they represent a unique pricing problem. The cost of carry method is based on the possibility of storing, or holding the underlying asset. However, in the case of weather contracts such as HDD or CDD, the underlying asset is not storable in any meaningful way.
As such, the cost of carry approach is not relevant and pricing is based on a discounted value of the payoff from the futures contract. A statistical model is required to generate the possible range of outcomes that the underlying weather index may take and subsequent payoffs ensuing from the derivatives contract. The discount rate will be market determined given the prices for contracts that the market will bear.
Weather derivatives are of great economic importance in that they allow participants to manage a very specific form of risk. While weather futures contracts currently make up a relatively small proportion of trading in derivatives markets, it is a sector that is experiencing rapid growth - particularly as more companies recognize the correlation between weather and profit.
This is an edited version of an article originally published at The Conversation.
Post Options
Thanks(0)
Quote Reply
Posted: April 24 2012 at 5:11pm
Sea surface temperatures in the eastern tropical Pacific Ocean swing back and forth every few years (sometimes more) like an irregular pendulum. The warm phase is known as El Ni�o; the cool phase�which it has been in for the past two winters�is called La Nina. According to NOAA's April 2012 ENSO Diagnostics Discussion, La Ni�a is fading and will likely be over by the end of April.
The pair of maps shows the difference from average temperature in the tropical Pacific near the winter peak of the La Nina event on January 12 and on April 15. Places where the ocean was up to 5 degrees Celsius colder than the 1981-2010 average are dark blue, average temperatures are white, and places where temperatures were up to 5 degrees C warmer than average are red.
Although one climate pattern can't explain every bit of wacky weather that happens on Earth, when it comes to making seasonal forecasts, the occurrence of an El Ni�o or La Ni�a event is the single most useful predictor that climate scientists have for forecasting if seasonal precipitation and temperature are likely to be above or below normal.
By studying past La Nina and El Nino episodes, scientists have detected predictable rainfall and temperature patterns that often occur from one episode to the next. La Ni�a winters, for example, have a high probability of being colder and wetter (or snowier) than normal in the U.S. Pacific Northwest, and warmer and drier in the Southeast. On the far side of the Pacific, La Nina is usually accompanied by heavier than normal rainfall and cooler than usual temperatures in eastern Australia.
With La Nina fading, forecasts for the rest of spring and summer are likely to be less confident, with factors such as current soil moisture and long-term trends providing weaker hints as to what the climate over the next few seasons will be like.
Post Options
Thanks(0)
Quote Reply
Posted: April 22 2012 at 10:50pm
 Post Options
Thanks(0)
Quote Reply
Posted: April 22 2012 at 8:00pm
Post Options
Thanks(0)
Quote Reply
Posted: April 22 2012 at 8:00pm(Despite US records of warmest March)
Month ranks 16th warmest March for globe; La Niña expected to dissipate by the end of April
The average global temperature for March 2012 made it the coolest March since 1999, yet the 16th warmest since record keeping began in 1880. Arctic sea ice extent during the month was below average but was the largest extent since 2008 and one of the largest March extents of the past decade. Additionally, La Niña conditions continued to weaken during March as temperatures across the equatorial Pacific Ocean warmed during the last two months. According to NOAA's Climate Prediction Center, La Niña is expected to dissipate by the end of April 2012.
Included in this report: NOAA is now making it easier to find information about margins of error associated with its global temperature calculations. NCDC previously displayed this information in certain graphics associated with the report, but it will now publish these ranges in the form of "plus or minus" values associated with each monthly temperature calculation. These values are calculated using techniques published in peer-reviewed scientific literature
Post Options
Thanks(0)
Quote Reply
Posted: April 12 2012 at 11:25amFirst quarter of 2012 also warmest on record; early March tornado outbreak is year's first "billion dollar disaster"
Record and near-record breaking temperatures dominated the eastern two-thirds of the nation and contributed to the warmest March on record for the contiguous United States, a record that dates back to 1895. More than 15,000 warm temperature records were broken during the month.
The average temperature of 51.1 F was 8.6 degrees above the 20th century average for March and 0.5 F warmer than the previous warmest March in 1910. Of the more than 1,400 months (117+ years) that have passed since the U.S. climate record began, only one month, January 2006, has seen a larger departure from its average temperature than March 2012.
Note: The March 2012 Monthly Climate Report for the United States has several pages of supplemental information and data regarding the unprecedented early 2012 temperatures.


http://www.ncdc.noaa.gov/sotc/summary-info/national/2012/3
 Post Options
Thanks(0)
Quote Reply
Posted: March 03 2012 at 10:17am
Post Options
Thanks(0)
Quote Reply
Posted: March 03 2012 at 9:28am
Post Options
Thanks(0)
Quote Reply
Posted: March 03 2012 at 10:17am
Post Options
Thanks(0)
Quote Reply
Posted: March 03 2012 at 9:28amFeb. 27, 2012 Contact: Katy Human, 303-497-4747

In 2008, the year most of the data were collected, Weld County had nearly 14,000 operating oil and gas wells.
The research team's chemical fingerprinting work showed that oil and gas equipment and activities - well pads equipment including condensate storage tanks, pipelines, compressors and more - leaked or vented an estimated 4 percent of all natural gas produced to the atmosphere. That loss is about double the previous best-guess estimate, based on engineering calculations and industry data, of about 2 percent loss.
"We may have been significantly underestimating methane emissions by this industry in this region," Petron said.
The team also found that emissions of benzene, a
known carcinogen, are underestimated. Benzene is tracked and regulated by the
Environmental Protection Agency (EPA).
Petron and her colleagues found
evidence of at least two sources of benzene in the region: oil and gas
operations and something else, most likely cars and trucks on roads. And the new
study found benzene emissions from oil and gas operations in the region to be
significantly higher than expected, between 385 and 2,055 metric tons in 2008,
compared with earlier estimates ranging from about 60 to 145 per year.
Finally, the researchers' findings suggest that oil and gas-related emissions of more reactive volatile organic compounds, which contribute to lung-damaging ozone pollution, are also underestimated. More reactive VOCs were not directly measured in the 2008 study, but are almost certainly co-emitted with methane and larger alkanes. According to the EPA, the northern Front Range has been out of compliance with federal health-based standards in the summer since 2007.
Chemist Greg Frost, Ph.D. also with NOAA and CIRES and a co-author of the new study, said the work demonstrates the value of studying emissions from several perspectives. Top-down studies (such as from the tall tower) can complement and verify bottom-up approaches (such as estimates based on average leak rates at pipe junctions).
"What Gabrielle has done is to use the mobile laboratory and tower data to make top-down estimates of emissions, which can be used to evaluate the bottom-up estimates from industry and regulatory agencies," Frost said. "This is going to inspire a lot more research."
Post Options
Thanks(0)
Quote Reply
Posted: March 02 2012 at 9:57pm
Post Options
Thanks(0)
Quote Reply
Posted: March 02 2012 at 1:46pm
The Earth's oceans may be acidifying faster than at any point during the last 300 million years due to industrial emissions, endangering marine life from oysters and reefs to sea-going salmon, researchers said.
The scientists found surging levels of carbon dioxide in the atmosphere forced down the pH of the ocean by 0.1 unit in the last century, 10 times faster than the closest historical comparison from 56 million years ago, New York�s Columbia University, which led the research, said yesterday in a statement. The seas absorb CO2 from the atmosphere, forming carbonic acid. The lower the pH level in the seas, the more acidic they are.
Past instances of ocean acidification have been linked with mass extinctions of marine creatures so the current one could also threaten important species, according to Baerbel Hoenisch, the paleoceanographer at Columbia who was lead author of the paper that appeared in the journal Science.
"If industrial carbon emissions continue at the current pace, we may lose organisms we care about - coral reefs, oysters, salmon," Hoenisch said.
The UN�s Intergovernmental Panel on Climate Change has said ocean pH may fall another 0.3 units this century, according to Columbia. The closest change to the current pace occurred during the so-called Paleocene-Eocene Thermal Maximum about 56 million years ago, when a doubling of the atmospheric concentration of carbon dioxide may have pushed pH levels down by 0.45 units over 20,000 years, according to the researchers.
Then, fossil records indicate as many as half of all species of seabed-dwelling single-celled creatures called benthic foraminifers went extinct, suggesting species higher up the food chain may also have died out, they said.
The scientists used fossil records including the preservation of calcium carbonate in ocean sediments and the concentrations of various elements to reconstruct past ocean conditions. Two other mass extinctions about 200 million years and 252 million years ago may also be linked to acidification, though there�s less fossil evidence, according to the study.
"Although similarities exist, no past event perfectly parallels future projections in terms of disrupting the balance of ocean carbonate chemistry - a consequence of the unprecedented rapidity of CO2 release currently taking place," the researchers wrote.
Post Options
Thanks(0)
Quote Reply
Posted: February 13 2012 at 7:09am  (Credit: NOAA)
During January, warmer-than-average conditions enveloped most of the contiguous United States, with widespread below-average precipitation. The overall weather pattern for the month was reflected in the lack of snow for much of the Northern Plains, Midwest, and Northeast. This scenario was in stark contrast to Alaska where several towns had their coldest January on record.
This monthly analysis from NOAA is part of the suite of climate services we provide government, business and community leaders so they can make informed decisions.
The average contiguous U.S. temperature in January was 36.3 degrees F, 5.5 degrees F above the 1901-2000 long-term average -- the fourth warmest January on record, and the warmest since 2006. Precipitation, averaged across the nation, was 1.85 inches. This was 0.37 inch below the long-term average, with variability between regions.
U.S. Climate Highlights � January
U.S. Climate Highlights � Winter to Date (December 2011-January 2012)
U.S. Climate Highlights � Last 12 months (February 2011-January 2012)
http://www.noaa.gov/features/02_monitoring/jan_stats.html
Post Options
Thanks(0)
Quote Reply
Posted: December 02 2011 at 7:20amThe 2011 Arctic Report Card, compiled by scientists from 14 countries, "shows that record-setting changes are occurring throughout the Arctic environmental system.
"Given the projection of continued global warming, it is very likely that major Arctic changes will continue in years to come, with increasing climatic, biological and social impacts," the report said.
The authors of the annual report -- first released in 2006 -- said there is now sufficient data to indicate a "persistent decline in the thickness and summer extent of the sea ice cover, and a warmer, fresher upper ocean."
Average temperatures over much of the Arctic have risen some 2.5 degrees F (1.5 degrees C) from a 1981-2010 baseline, and the minimum area of sea ice recorded this year, in September 2011, was the second lowest since 1979.
The "profound and continuing" changes have had an uneven impact on Arctic wildlife, threatening the icy habitats of polar bears and walruses but giving whales greater access to northern feeding areas, the report said.
The warming has also caused new vegetation to sprout in many areas, and has led to a 20 percent increase in phytoplankton, microscopic organisms that are the basis of the oceanic food chain.
The report also found that changes in Arctic winter wind patterns first detected in 2010 have continued.
"The Arctic region continues to warm, with less sea ice and greater green vegetation," said Monica Medina, of the US National Oceanic and Atmospheric Administration (NOAA).
By SETH BORENSTEIN
WASHINGTON (AP) - Massive amounts of greenhouse gases trapped below thawing permafrost will likely seep into the air over the next several decades, accelerating and amplifying global warming, scientists warn.
Those heat-trapping gases under the frozen Arctic ground may be a bigger factor in global warming than the cutting down of forests, and a scenario that climate scientists hadn't quite accounted for, according to a group of permafrost experts. The gases won't contribute as much as pollution from power plants, cars, trucks and planes, though.
The permafrost scientists predict that over the next three decades a total of about 45 billion metric tons of carbon from methane and carbon dioxide will seep into the atmosphere when permafrost thaws during summers. That's about the same amount of heat-trapping gas the world spews during five years of burning coal, gas and other fossil fuels
And the picture is even more alarming for the end of the century. The scientists calculate that about than 300 billion metric tons of carbon will belch from the thawing Earth from now until 2100.
Adding in that gas means that warming would happen "20 to 30 percent faster than from fossil fuel emissions alone," said Edward Schuur of the University of Florida. "You are significantly speeding things up by releasing this carbon."
Usually the first few to several inches of permafrost thaw in the summer, but scientists are now looking at up to 10 feet of soft unfrozen ground because of warmer temperatures, he said. The gases come from decaying plants that have been stuck below frozen ground for millennia.
Schuur and 40 other scientists in the Permafrost Carbon Research Network met this summer and jointly wrote up their findings, which were published in the journal Nature on Wednesday.
"The survey provides an important warning that global climate warming is likely to be worse than expected," said Jay Zwally, a NASA polar scientist who wasn't part of the study. "Arctic permafrost has been like a wild card."
When the Nobel Prize-winning panel of climate scientists issued its last full report in 2007, it didn't even factor in trapped methane and carbon dioxide from beneath the permafrost. Diplomats are meeting this week in South Africa to find ways of curbing human-made climate change.
Schuur and others said increasing amounts of greenhouse gas are seeping out of permafrost each year. Some is methane, which is 25 times stronger than carbon dioxide in trapping heat.
In a recent video, University of Alaska Fairbanks professor Katey Walter Anthony, a study co-author, is shown setting leaking methane gas on fire with flames shooting far above her head.
"Places like that are all around," Anthony said in a phone interview. "We're tapping into old carbon that has been locked up in the ground for 30,000 to 40,000 years."
That triggers what Anthony and other scientists call a feedback cycle. The world warms, mostly because of human-made greenhouse gases. That thaws permafrost, releasing more natural greenhouse gas, augmenting the warming.
There are lots of unknowns and a large margin of error because this is a relatively new issue with limited data available, the scientists acknowledge.
"It's very much a seat-of-the-pants expert assessment," said Stanford University's Chris Field, who wasn't involved in the new report.
The World Meteorological Organization this week said the worst of the warming in 2011 was in the northern areas - where there is permafrost - and especially Russia. Since 1970, the Arctic has warmed at a rate twice as fast as the rest of the globe.
The thawing permafrost also causes trees to lean - scientists call them "drunken trees" - and roads to buckle. Study co-author F. Stuart Chapin III said when he first moved to Fairbanks the road from his house to the University of Alaska had to be resurfaced once a decade.
"Now it gets resurfaced every year due to thawing permafrost," Chapin said.
Post Options
Thanks(0)
Quote Reply
Posted: November 17 2011 at 9:42amNovember 15, 2011
The globe experienced its eighth warmest October since record keeping began in 1880. Arctic sea ice extent was the second smallest extent on record for October at 23.5 percent below average. Additionally, La Ni�a conditions strengthened during October 2011. According to NOAA�s Climate Prediction Center, La Nina is expected to continue through the Northern Hemisphere winter.
This monthly analysis from NOAA's National Climatic Data Center is part of the suite of climate services NOAA provides government, business and community leaders so they can make informed decisions.
Global temperature highlights: October
Global temperature highlights: Year to date
Polar Sea Ice and Precipitation Highlights
http://www.noaanews.noaa.gov/stories2011/20111115_globalstats.html
Post Options
Thanks(0)
Quote Reply
Posted: November 12 2011 at 11:24amNovember 9, 2011

NOAA's Patricia Lang prepares to measure greenhouse gas levels inside a flask that is part of NOAA's global air sampling network. Network measurements, made from remote sites around the world, are critical to NOAA's Annual Greenhouse Gas Index, an annual measure of the heating effect of greenhouse gases added to the atmosphere by human activities. (Credit: NOAA)
NOAA�s updated Annual Greenhouse Gas Index (AGGI), which measures the direct climate influence of many greenhouse gases such as carbon dioxide and methane, shows a continued steady upward trend that began with the Industrial Revolution of the 1880s.
Started in 2004, the AGGI reached 1.29 in 2010. That means the combined heating effect of long-lived greenhouse gases added to the atmosphere by human activities has increased by 29 percent since 1990, the �index� year used as a baseline for comparison. This is slightly higher than the 2009 AGGI, which was 1.27, when the combined heating effect of those additional greenhouse gases was 27 percent higher than in 1990.
�The increasing amounts of long-lived greenhouse gases in our atmosphere indicate that climate change is an issue society will be dealing with for a long time,� said Jim Butler, director of the Global Monitoring Division of NOAA�s Earth System Research Laboratory in Boulder, Colo. �Climate warming has the potential to affect most aspects of society, including water supplies, agriculture, ecosystems and economies. NOAA will continue to monitor these gases into the future to further understand the impacts on our planet.�
The AGGI is analogous to the dial on an electric blanket � that dial does not tell you exactly how hot you will get, nor does the AGGI predict a specific temperature. Yet just as turning the dial up increases the heat of an electric blanket, a rise in the AGGI means greater greenhouse warming.

VIDEO: NOAA greenhouse gas index continues climbing. View YouTube video (Credit: NOAA)
NOAA scientists created the AGGI recognizing that carbon dioxide is not the only greenhouse gas affecting the balance of heat in the atmosphere. Many other long-lived gases also contribute to warming, although not currently as much as carbon dioxide.
The AGGI includes methane and nitrous oxide, for example, greenhouse gases that are emitted by human activities and also have natural sources and sinks. It also includes several chemicals known to deplete Earth�s protective ozone layer, which are also active as greenhouse gases. The 2010 AGGI reflects several changes in the concentration of these gases, including:

Scientists at NOAA�s Earth System Research Laboratory prepare the AGGI each year from atmospheric data collected through an international cooperative air sampling network of more than 100 sites around the world.
Post Options
Thanks(0)
Quote Reply
Posted: November 01 2011 at 10:54am|
Post Reply
|
Page 123 8> |
 Tweet
Tweet
|
| Forum Jump | Forum Permissions You cannot post new topics in this forum You cannot reply to topics in this forum You cannot delete your posts in this forum You cannot edit your posts in this forum You cannot create polls in this forum You can vote in polls in this forum |


")


 Topic Options


 Year-to-Date temperature evolution for Green Bay, Wisconsin versus the previous four warmest years.
 Heating Degree Day amomalies, October 2011 through March 2012, versus the 1981-2010 average.
