| PANDEMIC ALERT LEVEL |
| 123456 |
| Tracking the next pandemic: Avian Flu Talk |
Global Climate Change (Temperature Puzzle) |
Post Reply 
|
Page <1 45678> |
| Author | |||||||||||||||||||||||||||||||||||||||||||||||||||||||||||||||||||||||||||||||||||||||||||||||||||||||||||||||||||||||||||||||||||||||||||||||||||||||||||||||||||||||||||||||||||||||||||||||||||||||||||||||||||||||||||||||||||||||||||||||||||||||||||||||||||||||||||||||||||||||||||||||||||||||||||||||||||||||||||||||||
Mahshadin 
Admin Group 

Joined: January 26 2006 Location: United States Status: Offline Points: 3882 |
 Post Options Post Options
") Thanks(0) Thanks(0)
 Quote Reply Quote Reply
 Posted: November 18 2010 at 8:26am Posted: November 18 2010 at 8:26am |
||||||||||||||||||||||||||||||||||||||||||||||||||||||||||||||||||||||||||||||||||||||||||||||||||||||||||||||||||||||||||||||||||||||||||||||||||||||||||||||||||||||||||||||||||||||||||||||||||||||||||||||||||||||||||||||||||||||||||||||||||||||||||||||||||||||||||||||||||||||||||||||||||||||||||||||||||||||||||||||||
 Image Credit: Credit: NASA/Sarah DeWitt
TransantarcticThis image, taken on Nov. 10, 2010, aboard the IceBridge DC-8 flight mapping the Earth's polar regions, shows a Transantarctic mountain glacier. This year's IceBridge campaign is to map Earth's South Polar regions and is part of a six-year NASA mission--the largest airborne survey of Earth's polar ice ever flown. It is intended to yield a three-dimensional view of Arctic and Antarctic ice sheets, ice shelves and sea ice and provide a yearly, multi-instrument look at the behavior of the rapidly changing features of the Greenland and Antarctic ice. |
|||||||||||||||||||||||||||||||||||||||||||||||||||||||||||||||||||||||||||||||||||||||||||||||||||||||||||||||||||||||||||||||||||||||||||||||||||||||||||||||||||||||||||||||||||||||||||||||||||||||||||||||||||||||||||||||||||||||||||||||||||||||||||||||||||||||||||||||||||||||||||||||||||||||||||||||||||||||||||||||||
|
"In a time of universal deceit, telling the truth is a revolutionary act." G Orwell
|
|||||||||||||||||||||||||||||||||||||||||||||||||||||||||||||||||||||||||||||||||||||||||||||||||||||||||||||||||||||||||||||||||||||||||||||||||||||||||||||||||||||||||||||||||||||||||||||||||||||||||||||||||||||||||||||||||||||||||||||||||||||||||||||||||||||||||||||||||||||||||||||||||||||||||||||||||||||||||||||||||
 |
|||||||||||||||||||||||||||||||||||||||||||||||||||||||||||||||||||||||||||||||||||||||||||||||||||||||||||||||||||||||||||||||||||||||||||||||||||||||||||||||||||||||||||||||||||||||||||||||||||||||||||||||||||||||||||||||||||||||||||||||||||||||||||||||||||||||||||||||||||||||||||||||||||||||||||||||||||||||||||||||||
|
Mahshadin
Admin Group
Joined: January 26 2006 Location: United States Status: Offline Points: 3882 |
Post Options
Thanks(0)
Quote Reply
Posted: November 18 2010 at 8:28am |
||||||||||||||||||||||||||||||||||||||||||||||||||||||||||||||||||||||||||||||||||||||||||||||||||||||||||||||||||||||||||||||||||||||||||||||||||||||||||||||||||||||||||||||||||||||||||||||||||||||||||||||||||||||||||||||||||||||||||||||||||||||||||||||||||||||||||||||||||||||||||||||||||||||||||||||||||||||||||||||||
|
Youngest Nearby Black Hole
11.15.10
 This composite image shows a supernova within the galaxy M100 that may contain the youngest known black hole in our cosmic neighborhood. In this image, Chandra�s X-rays are colored gold, while optical data from ESO�s Very Large Telescope are shown in red, green, and blue, and infrared data from Spitzer are red. The location of the supernova, known as SN 1979C, is labeled. SN 1979C was first reported to be seen by an amateur astronomer in 1979. The galaxy M100 is located in the Virgo Cluster about 50 million light years from Earth. This approximately 30-year age, plus its relatively close distance, makes SN 1979C the nearest example where the birth of a black hole has been observed, if the interpretation by the scientists is correct. Data from Chandra, as well as NASA's Swift, the European Space Agency's XMM-Newton and the German ROSAT observatory revealed a bright source of X-rays that has remained steady for the 12 years from 1995 to 2007 over which it has been observed. This behavior and the X-ray spectrum, or distribution of X-rays with energy, support the idea that the object in SN 1979C is a black hole being fed either by material falling back into the black hole after the supernova, or from a binary companion. The scientists think that SN 1979C formed when a star about 20 times more massive than the Sun collapsed. It was a particular type of supernova where the exploded star had ejected some, but not all of its outer, hydrogen-rich envelope before the explosion, so it is unlikely to have been associated with a gamma-ray burst (GRB). Supernovas have sometimes been associated with GRBs, but only where the exploded star had completely lost its hydrogen envelope. Since most black holes should form when the core of a star collapses and a gamma-ray burst is not produced, this may be the first time that the common way of making a black hole has been observed. The very young age of about 30 years for the black hole is the observed value, that is the age of the remnant as it appears in the image. Astronomers quote ages in this way because of the observational nature of their field, where their knowledge of the Universe is based almost entirely on the electromagnetic radiation received by telescopes. Credits: X-ray: NASA/CXC/SAO/D.Patnaude et al, Optical: ESO/VLT, Infrared: NASA/JPL/Caltech |
|||||||||||||||||||||||||||||||||||||||||||||||||||||||||||||||||||||||||||||||||||||||||||||||||||||||||||||||||||||||||||||||||||||||||||||||||||||||||||||||||||||||||||||||||||||||||||||||||||||||||||||||||||||||||||||||||||||||||||||||||||||||||||||||||||||||||||||||||||||||||||||||||||||||||||||||||||||||||||||||||
|
"In a time of universal deceit, telling the truth is a revolutionary act." G Orwell
|
|||||||||||||||||||||||||||||||||||||||||||||||||||||||||||||||||||||||||||||||||||||||||||||||||||||||||||||||||||||||||||||||||||||||||||||||||||||||||||||||||||||||||||||||||||||||||||||||||||||||||||||||||||||||||||||||||||||||||||||||||||||||||||||||||||||||||||||||||||||||||||||||||||||||||||||||||||||||||||||||||
|
Mahshadin
Admin Group
Joined: January 26 2006 Location: United States Status: Offline Points: 3882 |
Post Options
Thanks(0)
Quote Reply
Posted: November 20 2010 at 9:09am |
||||||||||||||||||||||||||||||||||||||||||||||||||||||||||||||||||||||||||||||||||||||||||||||||||||||||||||||||||||||||||||||||||||||||||||||||||||||||||||||||||||||||||||||||||||||||||||||||||||||||||||||||||||||||||||||||||||||||||||||||||||||||||||||||||||||||||||||||||||||||||||||||||||||||||||||||||||||||||||||||
NOAA: October Ranked 8th Warmest on RecordNovember 18, 2010 October 2010 Temperatures Compared to the 1971 - 2000 Average. (Credit: NOAA)
October ranked the eighth warmest October on record. The first 10 months of 2010 tied with the same period in 1998 for the warmest combined land and ocean surface temperature on record. The global average land surface temperature for January-October was the second warmest on record behind 2007. The global ocean surface temperature for January-October tied with 2003 as the second warmest on record behind 1998. La Nina continues to be a significant factor in global ocean temperatures. The monthly analysis from NOAA's National Climatic Data Center, which is based on records going back to 1880, is part of the suite of climate services NOAA provides government, business and community leaders so they can make informed decisions.
Temperature Anomalies, October 2010. (Credit: NOAA)
Polar Sea Ice and Precipitation Highlights
http://www.noaanews.noaa.gov/stories2010/20101118_globalstats.html |
|||||||||||||||||||||||||||||||||||||||||||||||||||||||||||||||||||||||||||||||||||||||||||||||||||||||||||||||||||||||||||||||||||||||||||||||||||||||||||||||||||||||||||||||||||||||||||||||||||||||||||||||||||||||||||||||||||||||||||||||||||||||||||||||||||||||||||||||||||||||||||||||||||||||||||||||||||||||||||||||||
|
"In a time of universal deceit, telling the truth is a revolutionary act." G Orwell
|
|||||||||||||||||||||||||||||||||||||||||||||||||||||||||||||||||||||||||||||||||||||||||||||||||||||||||||||||||||||||||||||||||||||||||||||||||||||||||||||||||||||||||||||||||||||||||||||||||||||||||||||||||||||||||||||||||||||||||||||||||||||||||||||||||||||||||||||||||||||||||||||||||||||||||||||||||||||||||||||||||
|
|||||||||||||||||||||||||||||||||||||||||||||||||||||||||||||||||||||||||||||||||||||||||||||||||||||||||||||||||||||||||||||||||||||||||||||||||||||||||||||||||||||||||||||||||||||||||||||||||||||||||||||||||||||||||||||||||||||||||||||||||||||||||||||||||||||||||||||||||||||||||||||||||||||||||||||||||||||||||||||||||
|
Mahshadin
Admin Group
Joined: January 26 2006 Location: United States Status: Offline Points: 3882 |
Post Options
Thanks(0)
Quote Reply
Posted: November 21 2010 at 7:08am |
||||||||||||||||||||||||||||||||||||||||||||||||||||||||||||||||||||||||||||||||||||||||||||||||||||||||||||||||||||||||||||||||||||||||||||||||||||||||||||||||||||||||||||||||||||||||||||||||||||||||||||||||||||||||||||||||||||||||||||||||||||||||||||||||||||||||||||||||||||||||||||||||||||||||||||||||||||||||||||||||
|
Spacecraft Re-Assignment (Location) to study Solar Wind
___________________________________________
Dead Spacecraft Walking
A pair of NASA spacecrafts that were supposed to be dead a year ago are instead flying to the Moon for a breakthrough mission in lunar orbit.
"Their real names are THEMIS P1 and P2, but I call them 'dead spacecraft walking,'" says Vassilis Angelopoulos of UCLA, principal investigator of the THEMIS mission. "Not so long ago, we thought they were goners. Now they are beginning a whole new adventure."  An artist's concept of THEMIS-P1 and P2 (since renamed ARTEMIS-P1 and P2) in lunar orbit.
The story begins in 2007 when NASA launched a fleet of five spacecraft into Earth's magnetosphere to study the physics of geomagnetic storms. Collectively, they were called THEMIS, short for "Time History of Events and Macroscale Interactions during Substorms." P1 and P2 were the outermost members of the quintet. Working together, the probes quickly discovered a cornucopia of previously unknown phenomena such as colliding auroras, magnetic spacequakes, and plasma bullets shooting up and down Earth�s magnetic tail. These findings allowed researchers to solve several longstanding mysteries of the Northern Lights.  In their previous life, THEMIS-P1 and P2 were on a mission to study Northern Lights. The mission was going splendidly, except for one thing: Occasionally, P1 and P2 would pass through the shadow of Earth. The solar powered spacecraft were designed to go without sunlight for as much as three hours at a time, so a small amount of shadowing was no problem. But as the mission wore on, their orbits evolved and by 2009 the pair was spending as much as 8 hours a day in the dark. In their previous life, THEMIS-P1 and P2 were on a mission to study Northern Lights. The mission was going splendidly, except for one thing: Occasionally, P1 and P2 would pass through the shadow of Earth. The solar powered spacecraft were designed to go without sunlight for as much as three hours at a time, so a small amount of shadowing was no problem. But as the mission wore on, their orbits evolved and by 2009 the pair was spending as much as 8 hours a day in the dark. "The two spacecraft were running out of power and freezing to death," says Angelopoulos. "We had to do something to save them." The team brainstormed a solution. Because the mission had gone so well, the spacecraft still had an ample supply of fuel--enough to go to the Moon. "We could do some great science from lunar orbit," he says. NASA approved the trip and in late 2009, P1 and P2 headed away from the shadows of Earth. With a new destination, the mission needed a new name. The team selected ARTEMIS, the Greek goddess of the Moon. It also stands for "Acceleration, Reconnection, Turbulence and Electrodynamics of the Moon�s Interaction with the Sun." The first big events of the ARTEMIS mission are underway now. On August 25, 2010, ARTEMIS-P1 reached the L2 Lagrange point on the far side of the Moon. Following close behind, ARTEMIS-P2 entered the opposite L1 Lagrange point on Oct. 22nd. Lagrange points are places where the gravity of Earth and Moon balance, creating a sort of gravitational parking spot for spacecraft.  The ARTEMIS spacecraft are currently located at the L1 and L2 Earth-Moon Lagrange points.
"We're exploring the Earth-Moon Lagrange points for the first time," says Manfred Bester, Mission Operations Manager from the University of California at Berkeley, where the mission is operated. "No other spacecraft have orbited there." Because they lie just outside Earth's magnetosphere, Lagrange points are excellent places to study the solar wind. Sensors onboard the ARTEMIS probes will have in situ access to solar wind streams and storm clouds as they approach our planet�a possible boon to space weather forecasters. Moreover, working from opposite Lagrange points, the two spacecraft will be able to measure solar wind turbulence on scales never sampled by previous missions. "ARTEMIS is going to give us a fundamental new understanding of the solar wind," predicts David Sibeck, ARTEMIS project scientist at the Goddard Space Flight Center. "And that's just for starters." ARTEMIS will also explore the Moon's plasma wake�a turbulent cavity carved out of the solar wind by the Moon itself, akin to the wake just behind a speedboat. Sibeck says "this is a giant natural laboratory filled with a whole zoo of plasma waves waiting to be discovered and studied."  A Youtube video describes the complex orbits of the two Artemis spacecrafts. Another target of the ARTEMIS mission is Earth's magnetotail. Like a wind sock at a breezy airport, Earth's magnetic field is elongated by the action of the solar wind, forming a tail that stretches to the orbit of the Moon and beyond. Once a month around the time of the full Moon, the ARTEMIS probes will follow the Moon through the magnetotail for in situ observations. A Youtube video describes the complex orbits of the two Artemis spacecrafts. Another target of the ARTEMIS mission is Earth's magnetotail. Like a wind sock at a breezy airport, Earth's magnetic field is elongated by the action of the solar wind, forming a tail that stretches to the orbit of the Moon and beyond. Once a month around the time of the full Moon, the ARTEMIS probes will follow the Moon through the magnetotail for in situ observations. "We are particularly hoping to catch some magnetic reconnection events," says Sibeck. "These are explosions in Earth's magnetotail that mimic solar flares--albeit on a much smaller scale." ARTEMIS might even see giant 'plasmoids' accelerated by the explosions hitting the Moon during magnetic storms. These far-out explorations may have down-to-Earth applications. Plasma waves and reconnection events pop up on Earth, e.g., in experimental fusion chambers. Fundamental discoveries by ARTEMIS could help advance research in the area of clean renewable energy. After six months at the Lagrange points, ARTEMIS will move in closer to the Moon�at first only 100 km from the surface and eventually even less than that. From point-blank range, the spacecraft will look to see what the solar wind does to a rocky world when there's no magnetic field to protect it. "Earth is protected from solar wind by the planetary magnetic field," explains Angelopolous. "The Moon, on the other hand, is utterly exposed. It has no global magnetism." Studying how the solar wind electrifies, alters and erodes the Moon's surface could reveal valuable information for future explorers and give planetary scientists a hint of what's happening on other unmagnetized worlds around the solar system. Orbiting the Moon is notoriously tricky, however, because of irregularities in the lunar gravitational field. Enormous concentrations of mass (mascons) hiding just below the surface tug on spacecraft in unexpected ways, causing them over time to veer out of orbit. ARTEMIS will mitigate this problem using highly elongated orbits ranging from tens of km to 18,000 km. "We'll only be near the lunar surface for a brief time each orbit (accumulating a sizable dataset over the years)," explains Angelopoulos. "Most of the time we'll linger 18,000 km away where we can continue our studies of the solar wind at a safe distance." The Dead Spacecraft Walking may have a long life, after all. |
|||||||||||||||||||||||||||||||||||||||||||||||||||||||||||||||||||||||||||||||||||||||||||||||||||||||||||||||||||||||||||||||||||||||||||||||||||||||||||||||||||||||||||||||||||||||||||||||||||||||||||||||||||||||||||||||||||||||||||||||||||||||||||||||||||||||||||||||||||||||||||||||||||||||||||||||||||||||||||||||||
|
"In a time of universal deceit, telling the truth is a revolutionary act." G Orwell
|
|||||||||||||||||||||||||||||||||||||||||||||||||||||||||||||||||||||||||||||||||||||||||||||||||||||||||||||||||||||||||||||||||||||||||||||||||||||||||||||||||||||||||||||||||||||||||||||||||||||||||||||||||||||||||||||||||||||||||||||||||||||||||||||||||||||||||||||||||||||||||||||||||||||||||||||||||||||||||||||||||
|
|||||||||||||||||||||||||||||||||||||||||||||||||||||||||||||||||||||||||||||||||||||||||||||||||||||||||||||||||||||||||||||||||||||||||||||||||||||||||||||||||||||||||||||||||||||||||||||||||||||||||||||||||||||||||||||||||||||||||||||||||||||||||||||||||||||||||||||||||||||||||||||||||||||||||||||||||||||||||||||||||
|
Mahshadin
Admin Group
Joined: January 26 2006 Location: United States Status: Offline Points: 3882 |
Post Options
Thanks(0)
Quote Reply
Posted: November 27 2010 at 7:29am |
||||||||||||||||||||||||||||||||||||||||||||||||||||||||||||||||||||||||||||||||||||||||||||||||||||||||||||||||||||||||||||||||||||||||||||||||||||||||||||||||||||||||||||||||||||||||||||||||||||||||||||||||||||||||||||||||||||||||||||||||||||||||||||||||||||||||||||||||||||||||||||||||||||||||||||||||||||||||||||||||
|
Hurricane Season 2010: NASA Compares Rainfall of 2010 and 2005's Atlantic Hurricane Season Rainfall
11.26.10
The year 2010 was accurately predicted by the National Oceanic and Atmospheric Administration (NOAA) to be an active one with 14-23 tropical cyclones and 8-14 hurricanes predicted. NOAA's National Hurricane Center (NHC) in Miami, Fla. subsequently named 19 storms with 12 reaching hurricane strength.
The 2010 Atlantic hurricane season was the most active since the record breaking season of 2005. Hal Pierce of the Tropical Rainfall Measuring Mission, or TRMM satellite team at NASA's Goddard Space Flight Center in Greenbelt, Md. created a comparison between the tropical cyclone rainfall occurring in 2005 and 2010. These tropical cyclone rainfall analyses were both made at NASA Goddard using TRMM-based, near-real time Multi-satellite Precipitation data (TMPA).TRMM is a joint mission between NASA and the Japanese space agency JAXA.
 This image shows the tropical cyclone rainfall occurring in 2010. The tracks of tropical cyclones are shown with black lines. The highest tropical cyclone rainfall totals (between 28 and 32 inches or 71.1 to 81.2 centimeters) were located over the open waters of the Atlantic north of Puerto Rico. The largest rainfall totals appear in pink. Credit: NASA/SSAI, Hal Pierce  This image shows the tropical cyclone rainfall occurring in 2005. The tracks of tropical cyclones are shown with black lines. The highest tropical cyclone rainfall totals (between 28 and 32 inches or 71.1 to 81.2 centimeters) were located over the Caribbean Sea, eastern Gulf of Mexico, western Cuba and over the waters in the Atlantic off the southeastern U.S. The largest rainfall totals appear in pink. "It is immediately obvious from this comparison that the major difference is the locations of tropical cyclones," Pierce said. "During the 2010 hurricane season more hurricanes formed in the eastern Atlantic near the Cape Verde islands. These storms were steered around the south and western edge of the Atlantic subtropical high and recurved without touching the United States mainland. For this reason the highest tropical cyclone rainfall totals (between 28 and 32 inches or 71.1 to 81.2 centimeters) were located over the open waters of the Atlantic north of Puerto Rico. Southern Texas was the only location in the United States where 2010 tropical cyclone rainfall was greater than in 2005." A major concern early in the 2010 season was that hurricanes passing through the Gulf of Mexico would worsen the Deepwater Horizon oil spill disaster that occurred on April 20, 2010. It was feared that a hurricane moving through the oil spill would push oil deep into beaches and estuaries along the northeastern Gulf of Mexico but in 2010 most tropical cyclones were steered away from the mainland. Hurricane Alex ended up only causing a five day delay in the oil spill clean-up efforts. In 2005, TRMM satellite estimates showed the highest tropical cyclone rainfall totals (between 28 and 32 inches or 71.1 to 81.2 centimeters) were located over the Caribbean Sea, eastern Gulf of Mexico, western Cuba and over the waters in the Atlantic off the southeastern U.S. The largest rainfall totals appear in pink. For more information about individual storms in the 2010 hurricane season, visit NASA's 2010 Hurricane page storm index at http://www.nasa.gov/mission_pages/hurricanes/archives/index.html. For information about the 2005 storms, which include Katrina, Rita and Wilma, visit the Hurricane page storm index of 2005 at http://www.nasa.gov/mission_pages/hurricanes/archives/2005/past_years05.html. |
|||||||||||||||||||||||||||||||||||||||||||||||||||||||||||||||||||||||||||||||||||||||||||||||||||||||||||||||||||||||||||||||||||||||||||||||||||||||||||||||||||||||||||||||||||||||||||||||||||||||||||||||||||||||||||||||||||||||||||||||||||||||||||||||||||||||||||||||||||||||||||||||||||||||||||||||||||||||||||||||||
|
"In a time of universal deceit, telling the truth is a revolutionary act." G Orwell
|
|||||||||||||||||||||||||||||||||||||||||||||||||||||||||||||||||||||||||||||||||||||||||||||||||||||||||||||||||||||||||||||||||||||||||||||||||||||||||||||||||||||||||||||||||||||||||||||||||||||||||||||||||||||||||||||||||||||||||||||||||||||||||||||||||||||||||||||||||||||||||||||||||||||||||||||||||||||||||||||||||
|
|||||||||||||||||||||||||||||||||||||||||||||||||||||||||||||||||||||||||||||||||||||||||||||||||||||||||||||||||||||||||||||||||||||||||||||||||||||||||||||||||||||||||||||||||||||||||||||||||||||||||||||||||||||||||||||||||||||||||||||||||||||||||||||||||||||||||||||||||||||||||||||||||||||||||||||||||||||||||||||||||
|
Mahshadin
Admin Group
Joined: January 26 2006 Location: United States Status: Offline Points: 3882 |
Post Options
Thanks(0)
Quote Reply
Posted: November 27 2010 at 8:32am |
||||||||||||||||||||||||||||||||||||||||||||||||||||||||||||||||||||||||||||||||||||||||||||||||||||||||||||||||||||||||||||||||||||||||||||||||||||||||||||||||||||||||||||||||||||||||||||||||||||||||||||||||||||||||||||||||||||||||||||||||||||||||||||||||||||||||||||||||||||||||||||||||||||||||||||||||||||||||||||||||
|
Name this place in space
____________________________________________________
Image of the Day Gallery Image Credit: NASA
Harrat KhaybarHarrat Khaybar, Saudi Arabia lies in the western half of the Arabian peninsula and contains not only large expanses of sand and gravel, but also extensive lava fields known as haraat (harrat for a named field). According to scientists, the volcanic field was formed by eruptions along a long north-south linear vent system over the past 5 million years; the most recent recorded eruption took place between 600-700 A.D. |
|||||||||||||||||||||||||||||||||||||||||||||||||||||||||||||||||||||||||||||||||||||||||||||||||||||||||||||||||||||||||||||||||||||||||||||||||||||||||||||||||||||||||||||||||||||||||||||||||||||||||||||||||||||||||||||||||||||||||||||||||||||||||||||||||||||||||||||||||||||||||||||||||||||||||||||||||||||||||||||||||
|
"In a time of universal deceit, telling the truth is a revolutionary act." G Orwell
|
|||||||||||||||||||||||||||||||||||||||||||||||||||||||||||||||||||||||||||||||||||||||||||||||||||||||||||||||||||||||||||||||||||||||||||||||||||||||||||||||||||||||||||||||||||||||||||||||||||||||||||||||||||||||||||||||||||||||||||||||||||||||||||||||||||||||||||||||||||||||||||||||||||||||||||||||||||||||||||||||||
|
|||||||||||||||||||||||||||||||||||||||||||||||||||||||||||||||||||||||||||||||||||||||||||||||||||||||||||||||||||||||||||||||||||||||||||||||||||||||||||||||||||||||||||||||||||||||||||||||||||||||||||||||||||||||||||||||||||||||||||||||||||||||||||||||||||||||||||||||||||||||||||||||||||||||||||||||||||||||||||||||||
|
Mary008
V.I.P. Member

Joined: June 22 2009 Status: Offline Points: 5769 |
Post Options
Thanks(0)
Quote Reply
Posted: November 27 2010 at 2:30pm |
||||||||||||||||||||||||||||||||||||||||||||||||||||||||||||||||||||||||||||||||||||||||||||||||||||||||||||||||||||||||||||||||||||||||||||||||||||||||||||||||||||||||||||||||||||||||||||||||||||||||||||||||||||||||||||||||||||||||||||||||||||||||||||||||||||||||||||||||||||||||||||||||||||||||||||||||||||||||||||||||
|
good photo...had me fooled....space...
|
|||||||||||||||||||||||||||||||||||||||||||||||||||||||||||||||||||||||||||||||||||||||||||||||||||||||||||||||||||||||||||||||||||||||||||||||||||||||||||||||||||||||||||||||||||||||||||||||||||||||||||||||||||||||||||||||||||||||||||||||||||||||||||||||||||||||||||||||||||||||||||||||||||||||||||||||||||||||||||||||||
|
Mahshadin
Admin Group
Joined: January 26 2006 Location: United States Status: Offline Points: 3882 |
Post Options
Thanks(0)
Quote Reply
Posted: November 27 2010 at 6:25pm |
||||||||||||||||||||||||||||||||||||||||||||||||||||||||||||||||||||||||||||||||||||||||||||||||||||||||||||||||||||||||||||||||||||||||||||||||||||||||||||||||||||||||||||||||||||||||||||||||||||||||||||||||||||||||||||||||||||||||||||||||||||||||||||||||||||||||||||||||||||||||||||||||||||||||||||||||||||||||||||||||
|
|
|||||||||||||||||||||||||||||||||||||||||||||||||||||||||||||||||||||||||||||||||||||||||||||||||||||||||||||||||||||||||||||||||||||||||||||||||||||||||||||||||||||||||||||||||||||||||||||||||||||||||||||||||||||||||||||||||||||||||||||||||||||||||||||||||||||||||||||||||||||||||||||||||||||||||||||||||||||||||||||||||
|
"In a time of universal deceit, telling the truth is a revolutionary act." G Orwell
|
|||||||||||||||||||||||||||||||||||||||||||||||||||||||||||||||||||||||||||||||||||||||||||||||||||||||||||||||||||||||||||||||||||||||||||||||||||||||||||||||||||||||||||||||||||||||||||||||||||||||||||||||||||||||||||||||||||||||||||||||||||||||||||||||||||||||||||||||||||||||||||||||||||||||||||||||||||||||||||||||||
|
|||||||||||||||||||||||||||||||||||||||||||||||||||||||||||||||||||||||||||||||||||||||||||||||||||||||||||||||||||||||||||||||||||||||||||||||||||||||||||||||||||||||||||||||||||||||||||||||||||||||||||||||||||||||||||||||||||||||||||||||||||||||||||||||||||||||||||||||||||||||||||||||||||||||||||||||||||||||||||||||||
|
Mary008
V.I.P. Member
Joined: June 22 2009 Status: Offline Points: 5769 |
Post Options
Thanks(0)
Quote Reply
Posted: December 01 2010 at 10:17am |
||||||||||||||||||||||||||||||||||||||||||||||||||||||||||||||||||||||||||||||||||||||||||||||||||||||||||||||||||||||||||||||||||||||||||||||||||||||||||||||||||||||||||||||||||||||||||||||||||||||||||||||||||||||||||||||||||||||||||||||||||||||||||||||||||||||||||||||||||||||||||||||||||||||||||||||||||||||||||||||||
|
.
Cancun climate change summit: China's journey from Copenhagen
...................................................
................
Mary008
|
|||||||||||||||||||||||||||||||||||||||||||||||||||||||||||||||||||||||||||||||||||||||||||||||||||||||||||||||||||||||||||||||||||||||||||||||||||||||||||||||||||||||||||||||||||||||||||||||||||||||||||||||||||||||||||||||||||||||||||||||||||||||||||||||||||||||||||||||||||||||||||||||||||||||||||||||||||||||||||||||||
|
Mahshadin
Admin Group
Joined: January 26 2006 Location: United States Status: Offline Points: 3882 |
Post Options
Thanks(0)
Quote Reply
Posted: December 13 2010 at 6:40am |
||||||||||||||||||||||||||||||||||||||||||||||||||||||||||||||||||||||||||||||||||||||||||||||||||||||||||||||||||||||||||||||||||||||||||||||||||||||||||||||||||||||||||||||||||||||||||||||||||||||||||||||||||||||||||||||||||||||||||||||||||||||||||||||||||||||||||||||||||||||||||||||||||||||||||||||||||||||||||||||||
Forecast System to Warn of Toxic Algal Outbreaks Along Texas' ShorelineDecember 9, 2010  Karenia brevis red tide off the coast of Texas. (Credit: Chase Fountain, Texas Parks & Wildlife) Texas officials and coastal managers will now receive early notice of outbreaks of toxic algae that threaten public health and affect beach and fishing activities along the coast. Weekly bulletins generated by the NOAA Harmful Algal Bloom Operational Forecast System are based on observations from state partners, coupled with models, imagery and data from NOAA's powerful tide and current and weather systems. "Early notification of blooms is essential, and knowing that a bloom is occurring offshore provides our resource managers with sufficient time to coordinate with other responding agencies and formulate a plan before blooms hit the beaches," said Meredith Byrd, harmful algal bloom response coordinator for the Texas Parks and Wildlife Department. The most common harmful algal bloom that occurs in the Gulf of Mexico is known as "red tide" and is caused by the algal species Karenia brevis. Occurrences of red tide have historically resulted in fish and marine mammal deaths, shellfish contamination and even human health risk in the form of respiratory distress. Economic impacts of harmful algal blooms in the United States average $75 million annually including impacts on public health costs, commercial fishing closures, recreation and tourism losses and management and monitoring costs. Recognizing the need to provide harmful algal bloom information on a more consistent basis, NOAA worked to transform this former demonstration project into a fully operational system. Earlier this year, test bulletins of this system successfully tracked and informed Texas officials about the location of a harmful Dinophysis algal bloom that closed Texas' shellfisheries. NOAA has had an operational forecast in the eastern Gulf of Mexico for harmful algal blooms off the Florida coast since 2004 and with the expansion of the operational system, analysts will be available to review conditions daily with coastal managers from all of the Gulf of Mexico states. The NOAA Harmful Algal Bloom Operational Forecast System is operated by NOAA's CO-OPS, the nation's authoritative source for accurate, reliable and timely water-level and ocean current measurements, in close partnership with NOAA's National Centers for Coastal Ocean Science. Operational forecasts are also available for most of Florida and are in various stages of testing in other parts of the nation. To access the system, visit: http://www.co-ops.nos.noaa.gov/hab. |
|||||||||||||||||||||||||||||||||||||||||||||||||||||||||||||||||||||||||||||||||||||||||||||||||||||||||||||||||||||||||||||||||||||||||||||||||||||||||||||||||||||||||||||||||||||||||||||||||||||||||||||||||||||||||||||||||||||||||||||||||||||||||||||||||||||||||||||||||||||||||||||||||||||||||||||||||||||||||||||||||
|
"In a time of universal deceit, telling the truth is a revolutionary act." G Orwell
|
|||||||||||||||||||||||||||||||||||||||||||||||||||||||||||||||||||||||||||||||||||||||||||||||||||||||||||||||||||||||||||||||||||||||||||||||||||||||||||||||||||||||||||||||||||||||||||||||||||||||||||||||||||||||||||||||||||||||||||||||||||||||||||||||||||||||||||||||||||||||||||||||||||||||||||||||||||||||||||||||||
|
|||||||||||||||||||||||||||||||||||||||||||||||||||||||||||||||||||||||||||||||||||||||||||||||||||||||||||||||||||||||||||||||||||||||||||||||||||||||||||||||||||||||||||||||||||||||||||||||||||||||||||||||||||||||||||||||||||||||||||||||||||||||||||||||||||||||||||||||||||||||||||||||||||||||||||||||||||||||||||||||||
|
Mary008
V.I.P. Member
Joined: June 22 2009 Status: Offline Points: 5769 |
Post Options
Thanks(0)
Quote Reply
Posted: December 13 2010 at 9:14am |
||||||||||||||||||||||||||||||||||||||||||||||||||||||||||||||||||||||||||||||||||||||||||||||||||||||||||||||||||||||||||||||||||||||||||||||||||||||||||||||||||||||||||||||||||||||||||||||||||||||||||||||||||||||||||||||||||||||||||||||||||||||||||||||||||||||||||||||||||||||||||||||||||||||||||||||||||||||||||||||||
|
Thanks for the info... good to know they are keeping an eye on some areas...
The Land Of Stinking Waters
................................................. Is what the Indians called the Pacific shorline
where Lewis and Clark explored during Jefferson's presidency. I wonder if a rise in temperature caused a severe algae bloom at that time, causing massive fish kills. It would be interesting if they noted the appearance of the water, temperature etc. while there. I find it very odd...
that the west coast of California and the East coast
are not on the list as they have been known to have severe problems
with red tide.
NOAA Harmful Algal Bloom Operational Forecast System
Conditions Reports by Region - Southwest Florida Northwest Florida East Florida Texas
What are the impacts of red tides? ............................................................... In the Gulf of Mexico, one of the most common HABs is the phytoplankton species Karenia brevis. Commonly known as red tide, this organism produces a toxin that can cause respiratory irritation in humans, contaminate some shellfish, and affect the central nervous system of fish - potentially causing fish kills. This photo was taken by Greg Hughes on August 21, 2009
in Half Moon Bay, California, US
|
|||||||||||||||||||||||||||||||||||||||||||||||||||||||||||||||||||||||||||||||||||||||||||||||||||||||||||||||||||||||||||||||||||||||||||||||||||||||||||||||||||||||||||||||||||||||||||||||||||||||||||||||||||||||||||||||||||||||||||||||||||||||||||||||||||||||||||||||||||||||||||||||||||||||||||||||||||||||||||||||||
|
Mahshadin
Admin Group
Joined: January 26 2006 Location: United States Status: Offline Points: 3882 |
Post Options
Thanks(0)
Quote Reply
Posted: December 14 2010 at 6:56am |
||||||||||||||||||||||||||||||||||||||||||||||||||||||||||||||||||||||||||||||||||||||||||||||||||||||||||||||||||||||||||||||||||||||||||||||||||||||||||||||||||||||||||||||||||||||||||||||||||||||||||||||||||||||||||||||||||||||||||||||||||||||||||||||||||||||||||||||||||||||||||||||||||||||||||||||||||||||||||||||||
Global warming causes dramatic decline in global phytoplankton populationJuly 29th, 2010 4:04 pm ETPhytoplankton, microscopic photosynthetic organisms that inhabit the ocean's surface, have declined significantly over the last century, research suggests. This week in the journal Nature, researchers report a 1% yearly decline in the global phytoplankton population, totaling to around a 40% decline since 1950. This study is the first to look at the change in phytoplankton population on a global scale over such a long period of time. Researchers are able to measure the transparency of seawater by using a method devised in 1856 by an Italian astronomer. “Secchi disks” are simply white-colored disks that are lowered into the sea. The depth at which the disc is no longer visible is recorded. Researchers have compiled data from nearly 500,000 Secchi disks in a period spanning from 1899-2008. In order to get an accurate measurement of phytoplankton populations, the data from the Secchi disks is combined with measurements of chlorophyll concentrations at research sites and within phytoplankton and satellite measurements of ocean color. Researchers attribute the decline in population to rising water temperatures caused by climate change. Researcher Daniel Boyce from Dalhousie University in Halifax, Nova Scotia, Canada told BBC News: "What we think is happening is that the oceans are becoming more stratified as the water warms. The plants need sunlight from above and nutrients from below; and as it becomes more stratified, that limits the availability of nutrients." Why is this important? There are several different reasons. Like plants, phytoplankton use photosynthesis to convert energy captured from the sun into chemical energy. This chemical energy is then passed along through higher organisms of the food chain. When phytoplankton are consumed or die, carbon is distributed amongst the various layers of the ocean. As the ocean becomes more stratified, it is increasingly difficult for phytoplankton to have access to the nutrients essential for their survival. Phytoplankton lie at the base of almost every aquatic ecological pyramid; they are responsible for providing food to a tremendous number of organisms. Because phytoplankton reproduce very quickly, they maintain a constant population that is able to support the energy needs of the organisms they are consumed by. If the foundation of the pyramid is altered in any way, this could have disastrous consequences for the organisms that rely on the phytoplankton. How does this affect us? A decline in the phytoplankton population will have a detrimental effect on the fish populations in the already over-commercialized oceans. |
|||||||||||||||||||||||||||||||||||||||||||||||||||||||||||||||||||||||||||||||||||||||||||||||||||||||||||||||||||||||||||||||||||||||||||||||||||||||||||||||||||||||||||||||||||||||||||||||||||||||||||||||||||||||||||||||||||||||||||||||||||||||||||||||||||||||||||||||||||||||||||||||||||||||||||||||||||||||||||||||||
|
"In a time of universal deceit, telling the truth is a revolutionary act." G Orwell
|
|||||||||||||||||||||||||||||||||||||||||||||||||||||||||||||||||||||||||||||||||||||||||||||||||||||||||||||||||||||||||||||||||||||||||||||||||||||||||||||||||||||||||||||||||||||||||||||||||||||||||||||||||||||||||||||||||||||||||||||||||||||||||||||||||||||||||||||||||||||||||||||||||||||||||||||||||||||||||||||||||
|
|||||||||||||||||||||||||||||||||||||||||||||||||||||||||||||||||||||||||||||||||||||||||||||||||||||||||||||||||||||||||||||||||||||||||||||||||||||||||||||||||||||||||||||||||||||||||||||||||||||||||||||||||||||||||||||||||||||||||||||||||||||||||||||||||||||||||||||||||||||||||||||||||||||||||||||||||||||||||||||||||
|
Mahshadin
Admin Group
Joined: January 26 2006 Location: United States Status: Offline Points: 3882 |
Post Options
Thanks(0)
Quote Reply
Posted: December 14 2010 at 7:15am |
||||||||||||||||||||||||||||||||||||||||||||||||||||||||||||||||||||||||||||||||||||||||||||||||||||||||||||||||||||||||||||||||||||||||||||||||||||||||||||||||||||||||||||||||||||||||||||||||||||||||||||||||||||||||||||||||||||||||||||||||||||||||||||||||||||||||||||||||||||||||||||||||||||||||||||||||||||||||||||||||
|
|||||||||||||||||||||||||||||||||||||||||||||||||||||||||||||||||||||||||||||||||||||||||||||||||||||||||||||||||||||||||||||||||||||||||||||||||||||||||||||||||||||||||||||||||||||||||||||||||||||||||||||||||||||||||||||||||||||||||||||||||||||||||||||||||||||||||||||||||||||||||||||||||||||||||||||||||||||||||||||||||
|
"In a time of universal deceit, telling the truth is a revolutionary act." G Orwell
|
|||||||||||||||||||||||||||||||||||||||||||||||||||||||||||||||||||||||||||||||||||||||||||||||||||||||||||||||||||||||||||||||||||||||||||||||||||||||||||||||||||||||||||||||||||||||||||||||||||||||||||||||||||||||||||||||||||||||||||||||||||||||||||||||||||||||||||||||||||||||||||||||||||||||||||||||||||||||||||||||||
|
|||||||||||||||||||||||||||||||||||||||||||||||||||||||||||||||||||||||||||||||||||||||||||||||||||||||||||||||||||||||||||||||||||||||||||||||||||||||||||||||||||||||||||||||||||||||||||||||||||||||||||||||||||||||||||||||||||||||||||||||||||||||||||||||||||||||||||||||||||||||||||||||||||||||||||||||||||||||||||||||||
|
Mary008
V.I.P. Member
Joined: June 22 2009 Status: Offline Points: 5769 |
Post Options
Thanks(0)
Quote Reply
Posted: December 15 2010 at 2:31pm |
||||||||||||||||||||||||||||||||||||||||||||||||||||||||||||||||||||||||||||||||||||||||||||||||||||||||||||||||||||||||||||||||||||||||||||||||||||||||||||||||||||||||||||||||||||||||||||||||||||||||||||||||||||||||||||||||||||||||||||||||||||||||||||||||||||||||||||||||||||||||||||||||||||||||||||||||||||||||||||||||
|
.
thanks Mahs... that is very handy...much faster then the usual.... it gives the total picture.
I can also see weather where my family members live. M.
.............
|
|||||||||||||||||||||||||||||||||||||||||||||||||||||||||||||||||||||||||||||||||||||||||||||||||||||||||||||||||||||||||||||||||||||||||||||||||||||||||||||||||||||||||||||||||||||||||||||||||||||||||||||||||||||||||||||||||||||||||||||||||||||||||||||||||||||||||||||||||||||||||||||||||||||||||||||||||||||||||||||||||
|
Mahshadin
Admin Group
Joined: January 26 2006 Location: United States Status: Offline Points: 3882 |
Post Options
Thanks(0)
Quote Reply
Posted: December 21 2010 at 7:42pm |
||||||||||||||||||||||||||||||||||||||||||||||||||||||||||||||||||||||||||||||||||||||||||||||||||||||||||||||||||||||||||||||||||||||||||||||||||||||||||||||||||||||||||||||||||||||||||||||||||||||||||||||||||||||||||||||||||||||||||||||||||||||||||||||||||||||||||||||||||||||||||||||||||||||||||||||||||||||||||||||||
|
National Overview NOAA National Climatic As Northern Hemisphere autumn transitions into winter during this time of year, the angle of the sun above the horizon decreases, resulting in less solar heating of the northern latitudes. Temperatures cool, the atmospheric circulation intensifies, and strong extra-tropical cyclonic storms with associated cold fronts develop in the westerly flow. This is what happened in November as a very active weather pattern brought a series of winter storms to the Lower 48 States. Several strong low pressure systems, or extra-tropical cyclones, developed in the West or central Plains, bringing beneficial snow to the mountains and snow cover to the northern tier states. About 12 percent of the country was snow covered by the 10th of the month, with the snow coverage increasing to a third of the country with snowstorms after the 21st. A few systems developed in the South. As the storm systems moved eastward, cold air was pulled in behind them. Near the end of the month, moisture drawn northward along the associated cold fronts brought locally heavy rains to the  Temperature Highlights
· November temperatures, when averaged across the contiguous · Warmer-than-normal conditions were scattered about the · For the fall season (September-November), warmer-than-normal temperatures were predominant throughout much of the country. These conditions were mostly reflective from the above-average warmth during September and October. · The Northeast climate region has experienced persistent warmth through the entire year, resulting in its warmest January-November period on record. · Six states (New Hampshire, Vermont, Massachusetts, Rhode Island, Connecticut and New Jersey) had their warmest year-to-date period on record. · Based on monthly temperatures averaged from January-November,  Precipitation Highlights
· The average precipitation was 2.02 inches (51.3 mm), 0.1 inch (2.54 mm) below the 1901-2000 average. With most of the climate regions near-normal, the above-average precipitation in the West North Central and Central climate regions offset the below-average precipitation in the Southwest resulting in a near normal month for the contiguous U.S. Montana had its seventh wettest November on record. · Precipitation, when averaged across the · For the year-to-date period, the persistent storm track over the upper Midwest resulted in much-above-normal precipitation in Wisconsin, Minnesota, Iowa, North Dakota and South Dakota. Meanwhile, the Bermuda high situated in the western Other Items of Note · There were 57 preliminary tornado reports during November. This is near the long-term average, but marks the most tornado activity during November since 2005. Rare November tornadoes were reported in · Drought coverage continued to increased during November. The U.S. Drought Monitor reported 16.7 percent of the |
|||||||||||||||||||||||||||||||||||||||||||||||||||||||||||||||||||||||||||||||||||||||||||||||||||||||||||||||||||||||||||||||||||||||||||||||||||||||||||||||||||||||||||||||||||||||||||||||||||||||||||||||||||||||||||||||||||||||||||||||||||||||||||||||||||||||||||||||||||||||||||||||||||||||||||||||||||||||||||||||||
|
"In a time of universal deceit, telling the truth is a revolutionary act." G Orwell
|
|||||||||||||||||||||||||||||||||||||||||||||||||||||||||||||||||||||||||||||||||||||||||||||||||||||||||||||||||||||||||||||||||||||||||||||||||||||||||||||||||||||||||||||||||||||||||||||||||||||||||||||||||||||||||||||||||||||||||||||||||||||||||||||||||||||||||||||||||||||||||||||||||||||||||||||||||||||||||||||||||
|
|||||||||||||||||||||||||||||||||||||||||||||||||||||||||||||||||||||||||||||||||||||||||||||||||||||||||||||||||||||||||||||||||||||||||||||||||||||||||||||||||||||||||||||||||||||||||||||||||||||||||||||||||||||||||||||||||||||||||||||||||||||||||||||||||||||||||||||||||||||||||||||||||||||||||||||||||||||||||||||||||
|
Mahshadin
Admin Group
Joined: January 26 2006 Location: United States Status: Offline Points: 3882 |
Post Options
Thanks(0)
Quote Reply
Posted: December 31 2010 at 7:49am |
||||||||||||||||||||||||||||||||||||||||||||||||||||||||||||||||||||||||||||||||||||||||||||||||||||||||||||||||||||||||||||||||||||||||||||||||||||||||||||||||||||||||||||||||||||||||||||||||||||||||||||||||||||||||||||||||||||||||||||||||||||||||||||||||||||||||||||||||||||||||||||||||||||||||||||||||||||||||||||||||
 On Monday, December 27 at 1731 UTC (12:31 p.m. EST) the GOES-13 satellite captured this visible image of the powerful low pressure system that brought snows from Georgia to Maine along the U.S. east coast. Some of the snowfall can be seen over South and North Carolina, Virginia, Maryland, Delaware, eastern Pennsylvania, New Jersey, and southeastern New York. The clouds of the low obscure New England in the image.
Credit: NOAA/NASA GOES Project http://www.nasa.gov/centers/goddard/news/features/2010/goes13-snow.html |
|||||||||||||||||||||||||||||||||||||||||||||||||||||||||||||||||||||||||||||||||||||||||||||||||||||||||||||||||||||||||||||||||||||||||||||||||||||||||||||||||||||||||||||||||||||||||||||||||||||||||||||||||||||||||||||||||||||||||||||||||||||||||||||||||||||||||||||||||||||||||||||||||||||||||||||||||||||||||||||||||
|
"In a time of universal deceit, telling the truth is a revolutionary act." G Orwell
|
|||||||||||||||||||||||||||||||||||||||||||||||||||||||||||||||||||||||||||||||||||||||||||||||||||||||||||||||||||||||||||||||||||||||||||||||||||||||||||||||||||||||||||||||||||||||||||||||||||||||||||||||||||||||||||||||||||||||||||||||||||||||||||||||||||||||||||||||||||||||||||||||||||||||||||||||||||||||||||||||||
|
|||||||||||||||||||||||||||||||||||||||||||||||||||||||||||||||||||||||||||||||||||||||||||||||||||||||||||||||||||||||||||||||||||||||||||||||||||||||||||||||||||||||||||||||||||||||||||||||||||||||||||||||||||||||||||||||||||||||||||||||||||||||||||||||||||||||||||||||||||||||||||||||||||||||||||||||||||||||||||||||||
|
Mahshadin
Admin Group
Joined: January 26 2006 Location: United States Status: Offline Points: 3882 |
Post Options
Thanks(0)
Quote Reply
Posted: January 08 2011 at 7:08pm |
||||||||||||||||||||||||||||||||||||||||||||||||||||||||||||||||||||||||||||||||||||||||||||||||||||||||||||||||||||||||||||||||||||||||||||||||||||||||||||||||||||||||||||||||||||||||||||||||||||||||||||||||||||||||||||||||||||||||||||||||||||||||||||||||||||||||||||||||||||||||||||||||||||||||||||||||||||||||||||||||
NOAA, Partners: Growing Hypoxic Zones Reduce Habitat for Billfish and TunaLess habitat could increase vulnerability to fishing, affect population assessmentsDecember 22, 2010 Billfish and tuna, important commercial and recreational fish species, may be more vulnerable to fishing pressure because of shrinking habitat according to a new study published by scientists from NOAA, The Billfish Foundation, and University of Miami Rosenstiel School of Marine and Atmospheric Science. An expanding zone of low oxygen, known as a hypoxic zone, in the Atlantic Ocean is encroaching upon these species� preferred oxygen-abundant habitat, forcing them into shallower waters where they are more likely to be caught.
Samples of surface skin slim are taken from this Atlantic sailfish to determine gender. (Credit: NOAA) During the study, published recently in the journal Fisheries Oceanography, scientists tagged 79 sailfish and blue marlin with satellite tracking devices in the western North Atlantic, off south Florida and the Caribbean; and eastern tropical Atlantic, off the coast of West Africa. The pop off archival satellite tags monitored horizontal and vertical movement patterns. Researchers confirmed that billfish prefer oxygen rich waters closer to the surface and will actively avoid waters low in oxygen. While these hypoxic zones occur naturally in many areas of the world�s tropical and equatorial oceans, scientists are concerned because these zones are expanding and occurring closer to the sea surface, and are expected to continue to grow as sea temperatures rise. �The hypoxic zone off West Africa, which covers virtually all the equatorial waters in the Atlantic Ocean, is roughly the size of the continental United States, and it�s growing,� said Dr. Eric D. Prince, NOAA�s Fisheries Service research fishery biologist. �With the current cycle of climate change and accelerated global warming, we expect the size of this zone to increase, further reducing the available habitat for these fish.�  This Atlantic sailfish was just tagged by NOAA scientists off Senegal as part of a study to evaluate how oxygen depleted zones in the eastern Atlantic affect habitat. (Credit: NOAA) Less available habitat can lead to more fish being caught since the fish are concentrated near the surface. Higher catch rates from these areas may give the false appearance of more abundant fish stocks. The shrinking availability of habitat and resulting increases to catch rates are important factors for scientists to consider when doing population assessments. Researchers forecast that climate change and its associated rise in ocean temperatures will further increase the expansion of hypoxic zones in the world�s oceans. As water temperature increases, the amount of oxygen dissolved in water decreases, further squeezing billfish into dwindling available habitat and exposing them to even higher levels of exploitation. NOAA�s mission is to understand and predict changes in the Earth's environment, from the depths of the ocean to the surface of the sun, and to conserve and manage our coastal and marine resources. Find us online and on Facebook. |
|||||||||||||||||||||||||||||||||||||||||||||||||||||||||||||||||||||||||||||||||||||||||||||||||||||||||||||||||||||||||||||||||||||||||||||||||||||||||||||||||||||||||||||||||||||||||||||||||||||||||||||||||||||||||||||||||||||||||||||||||||||||||||||||||||||||||||||||||||||||||||||||||||||||||||||||||||||||||||||||||
|
"In a time of universal deceit, telling the truth is a revolutionary act." G Orwell
|
|||||||||||||||||||||||||||||||||||||||||||||||||||||||||||||||||||||||||||||||||||||||||||||||||||||||||||||||||||||||||||||||||||||||||||||||||||||||||||||||||||||||||||||||||||||||||||||||||||||||||||||||||||||||||||||||||||||||||||||||||||||||||||||||||||||||||||||||||||||||||||||||||||||||||||||||||||||||||||||||||
|
|||||||||||||||||||||||||||||||||||||||||||||||||||||||||||||||||||||||||||||||||||||||||||||||||||||||||||||||||||||||||||||||||||||||||||||||||||||||||||||||||||||||||||||||||||||||||||||||||||||||||||||||||||||||||||||||||||||||||||||||||||||||||||||||||||||||||||||||||||||||||||||||||||||||||||||||||||||||||||||||||
|
Mahshadin
Admin Group
Joined: January 26 2006 Location: United States Status: Offline Points: 3882 |
Post Options
Thanks(0)
Quote Reply
Posted: January 08 2011 at 7:32pm |
||||||||||||||||||||||||||||||||||||||||||||||||||||||||||||||||||||||||||||||||||||||||||||||||||||||||||||||||||||||||||||||||||||||||||||||||||||||||||||||||||||||||||||||||||||||||||||||||||||||||||||||||||||||||||||||||||||||||||||||||||||||||||||||||||||||||||||||||||||||||||||||||||||||||||||||||||||||||||||||||
New NOAA Buoy to Help Close Gap in Climate Understanding South of AfricaTo better understand the effects of the ocean on global climate and weather, scientists from NOAA;s Pacific Marine Environmental Laboratory, or PMEL, deployed an Ocean Climate Station mooring -- an anchored buoy --on the edge of the warm Agulhas Return Current (ARC) southeast of South Africa. Although there is an array of climate buoys positioned in the tropics, this is one of only two deep ocean climate buoys positioned below the Tropic of Capricorn; the other is located south of Australia. The buoy is part of NOAA's climate observation and monitoring efforts. The Agulhas Return Current (ARC) Ocean Climate Station mooring preparing to be deployed on the South African Fisheries Research Ship Algoa at 38.5�S, 30�E, on the edge of the warm ARC southeast of South Africa. (Credit: NOAA) "With this mooring, we will be able to measure how this powerful current warms the atmosphere and some of the effects this has on the local meteorology and climate," said Meghan Cronin, Ph.D., principal investigator and oceanographer at PMEL. "More heat is released to the atmosphere in the ARC region than anywhere else in the entire Southern Hemisphere. This heating can affect winds, clouds and rainfall over a broad region." The ARC is a western boundary current, similar to the Gulf Stream in the North Atlantic and the Kuroshiro Extension in the North Pacific. With support from NOAA and the National Science Foundation, NOAA�s PMEL designed, built and deployed the heavily instrumented ARC surface mooring to monitor weather and compute the heat absorbed and released by this region of the ocean. Sensors include those that measure wind, air temperature, relative humidity, rain, solar and infrared radiation, barometric pressure, sea surface temperature and salinity, and near-surface currents. Sea surface temperature (SST) simulation from NOAA�s Geophysical Fluid Dynamics Laboratory (GFDL) high resolution coupled atmosphere-ocean model. The Agulhas Return Current (ARC) mooring was deployed at 38.5�S, 30�E. The two drifters were deployed northwest of the ARC mooring in the core of the Agulhas current. (Credit: NOAA/GFDL) "The buoy will also carry sensors to measure how much atmospheric carbon dioxide is absorbed into the ocean in this critical region for the global climate system," said Christopher Sabine, Ph.D., oceanographer at PMEL and participant in the ARC project. "Building a buoy to collect and transmit reliable data requires teamwork between the engineers and the scientists," said Chris Meinig, director of PMEL engineering, whose group designed and built the buoy. "Because of the location off South Africa, we had to carefully design, model and build something that has a chance of withstanding the violent weather, steep waves and strong currents." With the use of ship time provided by the Agulhas and Somali Current Large Marine Ecosystems Project, the mooring was deployed in 4,300 meters (12,900 feet) of water using the South African Fisheries Research Ship Algoa. Data are relayed to shore in near-real time and made available through PMEL and other climate and weather data centers. The ARC buoy is a member of the family of Ocean Climate Stations, which include Kuroshio Extension Observatory located east of Japan and Station Papa located in the Gulf of Alaska. These moorings act as reference stations for validating satellite observations and improving weather forecasting and climate models.  (ARC) Ocean Climate Station mooring deployed at 38.5 S, 30 E, on the edge of the warm ARC southeast of South Africa. (Credit: NOAA) The FRS Algoa also deployed two free-floating buoys, or drifters, provided by the NOAA Adopt-a-Drifter program, which will be part of the Global Drifter Array. These drifters measure surface temperature, current velocity and atmospheric barometric pressure. Students from Washington state and South Africa will track the drifters online and try to predict where they might go and why. Classroom participation within Africa is being coordinated through a partnership between NOAA, ASCLME, Global Learning and Observations to Benefit the Environment-Africa, the South African Weather Service and the South African Environmental Observation Network. NOAA's mission is to understand and predict changes in the Earth's environment, from the depths of the ocean to the surface of the sun, and to conserve and manage our coastal and marine resources. Find us online and on Facebook. |
|||||||||||||||||||||||||||||||||||||||||||||||||||||||||||||||||||||||||||||||||||||||||||||||||||||||||||||||||||||||||||||||||||||||||||||||||||||||||||||||||||||||||||||||||||||||||||||||||||||||||||||||||||||||||||||||||||||||||||||||||||||||||||||||||||||||||||||||||||||||||||||||||||||||||||||||||||||||||||||||||
|
"In a time of universal deceit, telling the truth is a revolutionary act." G Orwell
|
|||||||||||||||||||||||||||||||||||||||||||||||||||||||||||||||||||||||||||||||||||||||||||||||||||||||||||||||||||||||||||||||||||||||||||||||||||||||||||||||||||||||||||||||||||||||||||||||||||||||||||||||||||||||||||||||||||||||||||||||||||||||||||||||||||||||||||||||||||||||||||||||||||||||||||||||||||||||||||||||||
|
|||||||||||||||||||||||||||||||||||||||||||||||||||||||||||||||||||||||||||||||||||||||||||||||||||||||||||||||||||||||||||||||||||||||||||||||||||||||||||||||||||||||||||||||||||||||||||||||||||||||||||||||||||||||||||||||||||||||||||||||||||||||||||||||||||||||||||||||||||||||||||||||||||||||||||||||||||||||||||||||||
|
Mahshadin
Admin Group
Joined: January 26 2006 Location: United States Status: Offline Points: 3882 |
Post Options
Thanks(0)
Quote Reply
Posted: January 12 2011 at 8:45am |
||||||||||||||||||||||||||||||||||||||||||||||||||||||||||||||||||||||||||||||||||||||||||||||||||||||||||||||||||||||||||||||||||||||||||||||||||||||||||||||||||||||||||||||||||||||||||||||||||||||||||||||||||||||||||||||||||||||||||||||||||||||||||||||||||||||||||||||||||||||||||||||||||||||||||||||||||||||||||||||||
NOAA: 2010 Tied For Warmest Year on RecordJanuary 12, 2011 According to NOAA scientists, 2010 tied with 2005 as the warmest year of the global surface temperature record, beginning in 1880. This was the 34th consecutive year with global temperatures above the 20th century average. For the contiguous United States alone, the 2010 average annual temperature was above normal, resulting in the 23rd warmest year on record. This preliminary analysis is prepared by scientists at NOAA�s National Climatic Data Center in Asheville, N.C., and is part of the suite of climate services NOAA provides government, business and community leaders so they can make informed decisions. 2010 Global Climate Highlights:
U.S. Climate Highlights:
Scientists, researchers and leaders in government and industry use NOAA�s monthly reports to help track trends and other changes in the world's climate. This climate service has a wide range of practical uses, from helping farmers know what and when to plant, to guiding resource managers� critical decisions about water, energy and other vital assets. |
|||||||||||||||||||||||||||||||||||||||||||||||||||||||||||||||||||||||||||||||||||||||||||||||||||||||||||||||||||||||||||||||||||||||||||||||||||||||||||||||||||||||||||||||||||||||||||||||||||||||||||||||||||||||||||||||||||||||||||||||||||||||||||||||||||||||||||||||||||||||||||||||||||||||||||||||||||||||||||||||||
|
"In a time of universal deceit, telling the truth is a revolutionary act." G Orwell
|
|||||||||||||||||||||||||||||||||||||||||||||||||||||||||||||||||||||||||||||||||||||||||||||||||||||||||||||||||||||||||||||||||||||||||||||||||||||||||||||||||||||||||||||||||||||||||||||||||||||||||||||||||||||||||||||||||||||||||||||||||||||||||||||||||||||||||||||||||||||||||||||||||||||||||||||||||||||||||||||||||
|
|||||||||||||||||||||||||||||||||||||||||||||||||||||||||||||||||||||||||||||||||||||||||||||||||||||||||||||||||||||||||||||||||||||||||||||||||||||||||||||||||||||||||||||||||||||||||||||||||||||||||||||||||||||||||||||||||||||||||||||||||||||||||||||||||||||||||||||||||||||||||||||||||||||||||||||||||||||||||||||||||
|
Mahshadin
Admin Group
Joined: January 26 2006 Location: United States Status: Offline Points: 3882 |
Post Options
Thanks(0)
Quote Reply
Posted: January 25 2011 at 11:55am |
||||||||||||||||||||||||||||||||||||||||||||||||||||||||||||||||||||||||||||||||||||||||||||||||||||||||||||||||||||||||||||||||||||||||||||||||||||||||||||||||||||||||||||||||||||||||||||||||||||||||||||||||||||||||||||||||||||||||||||||||||||||||||||||||||||||||||||||||||||||||||||||||||||||||||||||||||||||||||||||||
|
Coming Launch (Late Feb 2011)
________________________________________________________
NASA's Glory Mission Will Study Key Pieces of the Climate Puzzle
01.20.11
Last week, NASA announced that 2010 was tied as the warmest year on record. Likewise, the last decade was the warmest in the 130-year global temperature record maintained by scientists at NASA�s Goddard Institute for Space Studies (GISS) in New York City. Meanwhile, at Vandenberg Air Force Base in California, engineers are preparing NASA's next Earth-observing mission -- a satellite called Glory -- for launch in late February. The satellite, which contains two instruments that will monitor key parts of the climate system, aims to offer a new stream of data that climatologists will use as part of an ongoing effort to improve the accuracy of climate models. The Aerosol Polarimetry Sensor (APS), a science instrument mounted on the Earth-facing side of the spacecraft, will collect information about small airborne particles called aerosols that can affect climate by absorbing and scattering light. The Total Irradiance Monitor (TIM), which is located on the opposite side of the spacecraft, facing the sun, will measure the intensity of solar radiation at the top of Earth�s atmosphere. While climatologists have a good understanding of the role that greenhouse gases have on climate, less is known about the impacts of aerosols and long-term solar variability. "We are trying to achieve better measurements of both aerosols and total solar irradiance in order to calculate the energy budget -- the amount of energy entering and exiting Earth�s atmosphere -- as accurately as possible," said Michael Mishchenko, Glory�s project scientist and a researcher at GISS. Perplexing Particles The need for better measurements is particularly acute for aerosols. "The range of uncertainty associated with the climate impact of aerosols is three or four times that of greenhouse gases," said James Hansen, the director of GISS and a member of Glory�s science team. Aerosol particles, or the gases that lead to their formation, can come from vehicle tailpipes and desert winds, from sea spray and campfires, volcanic eruptions and factories. Even lush forests, soils, or communities of plankton in the ocean can be sources of certain types of aerosols. Detecting subtle differences between the many different types of aerosols -- such as salt, mineral dust, soot, and smoke -- will be one of Glory's primary strengths. And by closely monitoring the shape and size distribution of aerosols, as well as the way in which the particles reflect light, scientists will be able to distinguish natural from human-produced aerosols more precisely. Of the 25 climate models included by the United Nations-- Intergovernmental Panel on Climate Change (IPCC) in a major report released in 2007, only a handful considered the scattering or absorbing role of aerosol types other than sulfates, a well-studied category of aerosol produced by volcanic eruptions and by burning certain fossil fuels. Meanwhile, clouds, which form in the presence of aerosols and can be more reflective when human-produced aerosol particles are present, remain a sort of terra incognito to climatologists. Less than a third of the IPCC models included aerosol impacts on clouds, even in a limited way, and, again, those that did only considered sulfates. Glory, with its innovative APS, aims to advance understanding of the problematic particles. While other NASA instruments--including ground, aircraft, and satellite-based instruments--have studied aerosols in the past, the APS is NASA's first satellite-based instrument that will do so by measuring the polarization of light, the orientation of light-wave vibrations. The Centre National d Etudes Spatiales (CNES), the French space agency, has launched instruments capable of measuring polarized light in the past. However, Mishchenko expects APS to make more accurate polarimetric measurements of aerosols because it will measure particles from more than 250 angles across nine different spectral channels. Each type of aerosol leaves a unique polarization signature on light it encounters. Glory scientists, like detectives analyzing blood droplets at a crime scene to reconstruct what happened, will look at the polarization of scattered light and work backwards to deduce the type of aerosol that must have scattered it. "We know the technique works because we�ve been testing it for a number of years with an airplane-based version of the APS called the Research Scanning Polarimeter (RSP)," said Brian Cairns, Glory's APS instrument scientist and a researcher at GISS. Monitoring the Sun Scientists used to describe the incoming energy from the sun -- the foundation of Earth�s climate -- as the "solar constant." However, satellite measurements made by numerous instruments during the last three decades have revealed that solar output actually fluctuates by about 0.1 percent over an 11-year cycle as the sun progresses through periods of more and less intense electromagnetic activity. "Those fluctuations do not explain the global warming the planet has experienced in the last few decades," said Judith Lean, a member of Glory�s science team and a researcher at the Naval Research Laboratory in Washington, D.C. "However, it�s possible -- probable even -- that longer-term solar cycles exist that could have an impact on climate." There are clues that broader solar cycles exist -- historical records of sunspots and other types of evidence show that the sun entered an extended quiet period of solar activity between 1645 and 1715 called the Maunder Minimum, for example -- but modern satellite instruments have only been available to monitor total solar irradiance since 1978. Glory�s TIM instrument will extend and improve upon the existing record of solar irradiance that multiple satellite missions -- some sponsored by NASA and others by international partners -- have maintained. NASA�s most recent solar irradiance instrument was launched in 2003 on the Solar Radiation and Climate Experiment (SORCE) satellite, and included a first-generation TIM instrument. Learning from that instrument, engineers have modified the electronics of the instrument to make the Glory TIM even more accurate. "The Glory TIM should be three times more accurate than the SORCE TIM and about ten times more accurate than earlier instruments," said Greg Kopp, a physicist at the Laboratory for Atmospheric and Space Physics (LASP) at the University of Colorado, Boulder, and the leader of the TIM science team. The Glory TIM has a key advantage: access to a one-of-a-kind TSI Radiometer Facility. Funded by NASA and built by LASP, the new facility has allowed Kopp's team to validate the TIM instrument -- as well as check many ground-based versions of some of the other instruments that have measured solar irradiance -- in the most rigorous manner to date. 
Glory, shown in this artist's concept, will study the roles of two critical elements of Earth's climate system: the sun's total solar irradiance and atmospheric airborne particles called aerosols. Both have significant direct and indirect effects on Earth's climate, and the two instruments on Glory will provide new insights into these complex processes. Credit: NASA
� Larger image � View related Flickr gallery Retrofitting a Spacecraft Overall, at 1.9 meters (6.2 feet) by 1.4 meters (4.6 feet), Glory is neither the largest nor the heaviest of NASA�s Earth-observing satellites. The whole of the spacecraft is not much taller than most people, and is slightly narrower than a park bench. It weighs about 525 kilograms (1,158 pounds), about half the weight of a vintage Volkswagen Beetle. But there's one detail that makes Glory particularly interesting: the spacecraft�s bus was originally designed for the Vegetation Canopy Lidar (VCL), a mission that never flew due to a technical glitch in the development of an instrument. Transforming VCL -- a spacecraft that would have launched on a larger rocket, flown in a different orbit, and faced slightly different conditions in space -- into Glory wasn�t easy. "We had to overcome some interesting engineering challenges, but we have done multiple rounds of environmental tests on all of the components on the spacecraft and we�re confident Glory is ready for the space environment," said Bryan Fafaul, Glory�s project manager. When Glory launches, it will join a group of satellites called the A-Train that fly in similar low-Earth orbits and make coordinated measurements of the surface. "In a sense, we�ve created the first 'super-observatory' with the A-Train," said Joy Bretthauer, the program executive for Glory at NASA headquarters. Short Video Overview
|
|||||||||||||||||||||||||||||||||||||||||||||||||||||||||||||||||||||||||||||||||||||||||||||||||||||||||||||||||||||||||||||||||||||||||||||||||||||||||||||||||||||||||||||||||||||||||||||||||||||||||||||||||||||||||||||||||||||||||||||||||||||||||||||||||||||||||||||||||||||||||||||||||||||||||||||||||||||||||||||||||
|
"In a time of universal deceit, telling the truth is a revolutionary act." G Orwell
|
|||||||||||||||||||||||||||||||||||||||||||||||||||||||||||||||||||||||||||||||||||||||||||||||||||||||||||||||||||||||||||||||||||||||||||||||||||||||||||||||||||||||||||||||||||||||||||||||||||||||||||||||||||||||||||||||||||||||||||||||||||||||||||||||||||||||||||||||||||||||||||||||||||||||||||||||||||||||||||||||||
|
|||||||||||||||||||||||||||||||||||||||||||||||||||||||||||||||||||||||||||||||||||||||||||||||||||||||||||||||||||||||||||||||||||||||||||||||||||||||||||||||||||||||||||||||||||||||||||||||||||||||||||||||||||||||||||||||||||||||||||||||||||||||||||||||||||||||||||||||||||||||||||||||||||||||||||||||||||||||||||||||||
|
Mahshadin
Admin Group
Joined: January 26 2006 Location: United States Status: Offline Points: 3882 |
Post Options
Thanks(0)
Quote Reply
Posted: February 15 2011 at 7:10pm |
||||||||||||||||||||||||||||||||||||||||||||||||||||||||||||||||||||||||||||||||||||||||||||||||||||||||||||||||||||||||||||||||||||||||||||||||||||||||||||||||||||||||||||||||||||||||||||||||||||||||||||||||||||||||||||||||||||||||||||||||||||||||||||||||||||||||||||||||||||||||||||||||||||||||||||||||||||||||||||||||
NOAA: January 2011 Ranked 17th Warmest on RecordFebruary 15, 2011 Last month was the 17th warmest January for combined global land and ocean surface temperature since records began in 1880. La Ni�a, with its cooling effect on the central and eastern tropical Pacific, continues to be a factor in global ocean temperatures. The monthly analysis from NOAA�s National Climatic Data Center is part of the suite of climate services NOAA provides government, business and community leaders so they can make informed decisions. Global Temperature Highlights
|
|||||||||||||||||||||||||||||||||||||||||||||||||||||||||||||||||||||||||||||||||||||||||||||||||||||||||||||||||||||||||||||||||||||||||||||||||||||||||||||||||||||||||||||||||||||||||||||||||||||||||||||||||||||||||||||||||||||||||||||||||||||||||||||||||||||||||||||||||||||||||||||||||||||||||||||||||||||||||||||||||
|
"In a time of universal deceit, telling the truth is a revolutionary act." G Orwell
|
|||||||||||||||||||||||||||||||||||||||||||||||||||||||||||||||||||||||||||||||||||||||||||||||||||||||||||||||||||||||||||||||||||||||||||||||||||||||||||||||||||||||||||||||||||||||||||||||||||||||||||||||||||||||||||||||||||||||||||||||||||||||||||||||||||||||||||||||||||||||||||||||||||||||||||||||||||||||||||||||||
|
|||||||||||||||||||||||||||||||||||||||||||||||||||||||||||||||||||||||||||||||||||||||||||||||||||||||||||||||||||||||||||||||||||||||||||||||||||||||||||||||||||||||||||||||||||||||||||||||||||||||||||||||||||||||||||||||||||||||||||||||||||||||||||||||||||||||||||||||||||||||||||||||||||||||||||||||||||||||||||||||||
|
Mahshadin
Admin Group
Joined: January 26 2006 Location: United States Status: Offline Points: 3882 |
Post Options
Thanks(0)
Quote Reply
Posted: February 18 2011 at 1:39pm |
||||||||||||||||||||||||||||||||||||||||||||||||||||||||||||||||||||||||||||||||||||||||||||||||||||||||||||||||||||||||||||||||||||||||||||||||||||||||||||||||||||||||||||||||||||||||||||||||||||||||||||||||||||||||||||||||||||||||||||||||||||||||||||||||||||||||||||||||||||||||||||||||||||||||||||||||||||||||||||||||
|
Catching Space Weather in the Act
02.17.11

Illustration of Earth's magnetic field which looks a little like a sideways jellyfish. The jellyfish "tail" is known as the magnetotail and it flows off to the right in this picture, away from the sun on the "night side" of Earth. NASA's IBEX mission recently captured the first images of the magnetotail and the plasma sheet. Credit: ESA/C. T. Russel
Close to the globe, Earth's magnetic field wraps around the planet like a gigantic spherical web, curving in to touch Earth at the poles. But this isn't true as you get further from the planet. As you move to the high altitudes where satellites fly, nothing about that field is so simple. Instead, the large region enclosed by Earth's magnetic field, known as the magnetosphere, looks like a long, sideways jellyfish with its round bulb facing the sun and a long tail extending away from the sun.
In the center of that magnetic tail lies the plasma sheet. Here, strange things can happen. Magnetic field lines pull apart and come back together, creating explosions when they release energy. Disconnected bits of the tail called "plasmoids" get ejected into space at two million miles per hour. And legions of charged particles flow back toward Earth. Such space weather events cause auroras and, when very strong, can produce radiation events that could cause our satellites to fail. But until now no one has been able to take pictures of these fascinating processes in the plasma sheet. "Earth�s magnetic tail and its charged particles are invisible to conventional cameras that detect light,� says Jim Slavin, a magnetotail researcher who is the Director of the Heliophysics Division at NASA's Goddard Space Flight Center in Greenbelt, Md. "Events going on there have only been inferred based on other kinds of measurements." Now, special cameras aboard the Interstellar Boundary Explorer, or IBEX, spacecraft have snapped the first shots of this complex space environment. Instead of recording light, these two large single-pixel cameras detect energetic neutral atoms. Such fast-moving atoms are formed whenever atoms in the furthest reaches of Earth's atmosphere collide with charged particles and get sent speeding off in a new direction. Called Energetic Neutral Atom or ENA imaging, the technique captured unprecedented images of the plasma sheet.  The white lines show a model of where magnetic field lines are expected in Earth's magnetic atmosphere. The bright red colors show the densest part of the plasma sheet as imaged by IBEX. Credit: Southwest Research Institute/IBEX Science Team "The image alone is remarkable and would have made a great paper in and of itself because it's the first time we�ve imaged these important regions of the magnetosphere," says Dr. David McComas, principal investigator of the IBEX mission and assistant vice president of the Space Science and Engineering Division at Southwest Research Institute in San Antonio, Texas. The results appeared online in the Journal of Geophysical Research on Feb. 16, 2011. But when they looked closely, the group realized they didn't only have a picture of a quiescent plasma sheet. The various images appear to show a piece of the plasma sheet being bitten off and ejected down the tail. They think they've caught a plasmoid in the moment it was being formed. If they're correct, this would be the first time such an event was directly seen. "Imagine the magnetosphere as one of those balloons that people make animals out of. If you take your hands and squeeze the balloon, the pressure forces the air into another segment of the balloon," says McComas. "Similarly, the solar wind at times increases the pressure around the magnetosphere, resulting in a portion of the plasma sheet being pinched away from a larger mass and forced down the magnetotail." Because researchers believe this phenomenon generally occurs deeper in the magnetotail, the IBEX team is considering other explanations for the event, as well. One possibility is that the plasma sheet is being squeezed by the solar wind. Conceptual Image Lab While not specifically designed to observe the magnetosphere, IBEX's vantage point in space provides twice-yearly (spring and fall) seasons for viewing from outside the magnetosphere. Since its October 2008 launch, the IBEX science mission has flourished into multiple other research studies as well. In addition to supporting magnetospheric science, the spacecraft has also directly collected hydrogen and oxygen from the interstellar medium for the first time and produced the first ENA images of the outer edges of the bubble surrounding the Sun, called the heliosphere.
"Based upon the IBEX mission and its revolutionary ENA camera technology," says Slavin, "future NASA science missions may be able to make high definition videos of the development of space weather systems around the Earth to advance our scientific understanding of these phenomena and, eventually, enable space weather prediction like Earth weather prediction." IBEX is the latest in NASA's series of low-cost, rapidly developed Small Explorers spacecraft. The Southwest Research Institute developed the IBEX mission with a team of national and international partners. Goddard manages the Explorers Program for the Science Mission Directorate in Washington. |
|||||||||||||||||||||||||||||||||||||||||||||||||||||||||||||||||||||||||||||||||||||||||||||||||||||||||||||||||||||||||||||||||||||||||||||||||||||||||||||||||||||||||||||||||||||||||||||||||||||||||||||||||||||||||||||||||||||||||||||||||||||||||||||||||||||||||||||||||||||||||||||||||||||||||||||||||||||||||||||||||
|
"In a time of universal deceit, telling the truth is a revolutionary act." G Orwell
|
|||||||||||||||||||||||||||||||||||||||||||||||||||||||||||||||||||||||||||||||||||||||||||||||||||||||||||||||||||||||||||||||||||||||||||||||||||||||||||||||||||||||||||||||||||||||||||||||||||||||||||||||||||||||||||||||||||||||||||||||||||||||||||||||||||||||||||||||||||||||||||||||||||||||||||||||||||||||||||||||||
|
|||||||||||||||||||||||||||||||||||||||||||||||||||||||||||||||||||||||||||||||||||||||||||||||||||||||||||||||||||||||||||||||||||||||||||||||||||||||||||||||||||||||||||||||||||||||||||||||||||||||||||||||||||||||||||||||||||||||||||||||||||||||||||||||||||||||||||||||||||||||||||||||||||||||||||||||||||||||||||||||||
|
Mahshadin
Admin Group
Joined: January 26 2006 Location: United States Status: Offline Points: 3882 |
Post Options
Thanks(0)
Quote Reply
Posted: February 20 2011 at 10:23am |
||||||||||||||||||||||||||||||||||||||||||||||||||||||||||||||||||||||||||||||||||||||||||||||||||||||||||||||||||||||||||||||||||||||||||||||||||||||||||||||||||||||||||||||||||||||||||||||||||||||||||||||||||||||||||||||||||||||||||||||||||||||||||||||||||||||||||||||||||||||||||||||||||||||||||||||||||||||||||||||||
Climate Projections Show Human Health Impacts Possible Within 30 YearsNew studies demonstrate potential increases in waterborne toxins and microbes harmful to human healthFebruary 19, 2011 American Association for the Advancement of Science (AAAS) Annual Meeting: A panel of scientists speaking today at the annual meeting of the American Association for the Advancement of Science (AAAS) unveiled new research and models demonstrating how climate change could increase exposure and risk of human illness originating from ocean, coastal and Great Lakes ecosystems, with some studies projecting impacts to be felt within 30 years. "With 2010 the wettest year on record and third warmest for sea surface temperatures, NOAA and our partners are working to uncover how a changing climate can affect our health and our prosperity," said Jane Lubchenco, Ph.D., under secretary of commerce for oceans and atmosphere and NOAA administrator. "These studies and others like it will better equip officials with the necessary information and tools they need to prepare for and prevent risks associated with changing oceans and coasts." In several studies funded by NOAA's Oceans and Human Health Initiative, findings shed light on how complex interactions and climate change alterations in sea, land and sky make ocean and freshwater environments more susceptible to toxic algal blooms and proliferation of harmful microbes and bacteria. Climate Change Could Prolong Toxic Algal Outbreaks by 2040 or Sooner Herrold family harvesting oysters in Willapa Bay, Washington.(Credit: With permission from Bill Dewey, Taylor Shellfish Farms, Inc.) Using cutting-edge technologies to model future ocean and weather patterns, Stephanie Moore, Ph.D., with NOAA's West Coast Center for Oceans and Human Health and her partners at the University of Washington, are predicting longer seasons of harmful algal bloom outbreaks in Washington State's Puget Sound. The team looked at blooms of Alexandrium catenella, more commonly known as "red tide," which produces saxitoxin, a poison that can accumulate in shellfish. If consumed by humans, it can cause gastrointestinal and neurological symptoms including vomiting and muscle paralysis or even death in extreme cases. Longer harmful algal bloom seasons could translate to more days the shellfish fishery is closed, threatening the vitality of the $108 million shellfish industry in Washington state. "Changes in the harmful algal bloom season appear to be imminent and we expect a significant increase in Puget Sound and similar at-risk environments within 30 years, possibly by the next decade," said Moore. "Our projections indicate that by the end of the 21st century, blooms may begin up to two months earlier in the year and persist for one month later compared to the present-day time period of July to October." Moore and the research team indicate that the extended lead time offered by these projections will allow managers to put mitigation measures in place and sharpen their targets for monitoring to more quickly and effectively open and close shellfish beds instead of issuing a blanket closure for a larger swath of coast or be caught off guard by an unexpected bloom. The same model can be applied to other coastal areas around the world increasingly affected by harmful algal blooms and improve protection of human health against toxic outbreaks. More Atmospheric Dust From Global Desertification Could Lead to Increases of Harmful Bacteria in Oceans, Seafood
Researchers at the University of Georgia, a NOAA Oceans and Human Health Initiative Consortium for Graduate Training site, looked at how global desertification � and the resulting increase in atmospheric dust based on some climate change scenarios � could fuel the presence of harmful bacteria in the ocean and seafood.
Aerosolized dust is clearly visible in the satellite image and stretches across the Atlantic Ocean nearly continuously from Western Africa into the Caribbean and Gulf of Mexico. (Credit: With permission from SeaWIFS Project, NASA/Goddard Space Flight Center and ORBIMAGE.) Desert dust deposition from the atmosphere is considered one of the main contributors of iron in the ocean, has increased over the last 30 years and is expected to rise based on precipitation trends in western Africa. Iron is limited in ocean environments and is essential to most forms of life. In a study conducted in collaboration with the U.S. Geological Survey, Erin Lipp, Ph.D. and graduate student Jason Westrich demonstrated that the sole addition of desert dust and its associated iron into seawater significantly stimulates growth and persistence of Vibrios, a group of ocean bacteria that occur worldwide and can cause gastroenteritis and infectious diseases in humans. "Within 24 hours of mixing weathered desert dust from Morocco with seawater samples, we saw a 10-1000-fold growth in Vibrios, including one strain that could cause eye, ear, and open wound infections, and another strain that could cause cholera ," said Lipp. "Our next round of experiments will examine the response of the strains associated with seafood-related infections." Since 1996 Vibrio cases have jumped 85 percent in the United States based on reports that primarily track seafood-illnesses. It is possible this additional input of iron, along with rising sea surface temperatures, will affect these bacterial populations and may help to explain both current and future increases in human illnesses from exposure to contaminated seafood and seawater. Increased Rainfall and Dated Sewers Could Affect Water Quality in Great Lakes A changing climate with more rainstorms on the horizon could increase the risk of overflows of dated sewage systems, causing the release of disease-causing bacteria, viruses and protozoa into drinking water and onto beaches. In the past 10 years there have been more severe storms that trigger overflows. While there is some question whether this is due to natural variability or to climate change, these events provide another example as to how vulnerable urban areas are to climate.  Projected change in the frequency of one inch rainfalls across Wisconsin in days per decade. Global Climate Models were downscaled to produce region specific projections using a statistical method developed by the Climate Working Group of the Wisconsin Initiative on Climate Change Impacts. Data provided by D. Lorenz, M. Notaro, and D. Vimont, University of Wisconsin-Madison. (Credit: NOAA) Using fine-tuned climate models developed for Wisconsin, Sandra McLellan, Ph.D., at the University of Wisconsin-Milwaukee School of Freshwater Sciences, found spring rains are expected to increase in the next 50 years and areas with dated sewer systems are more likely to overflow because the ground is frozen and rainwater can�t be absorbed. As little as 1.7 inches of rain in 24 hours can cause an overflow in spring and the combination of increased temperatures -- changing snowfall to rainfall and increased precipitation -- can act synergistically to magnify the impact. McLellan and colleagues showed that under worst case scenarios there could be an average 20 percent increase in volume of overflows, and they expect the overflows to last longer. In Milwaukee, infrastructure investments have reduced sewage overflows to an average of three times per year, but other cities around the Great Lakes still experience overflows up to 40 times per year. "Hundreds of millions of dollars are spent on urban infrastructure, and these investments need to be directed to problems that have the largest impact on our water quality," said McLellan. "Our research can shed light on this dilemma for cities with aging sewer systems throughout the Great Lakes and even around the world." |
|||||||||||||||||||||||||||||||||||||||||||||||||||||||||||||||||||||||||||||||||||||||||||||||||||||||||||||||||||||||||||||||||||||||||||||||||||||||||||||||||||||||||||||||||||||||||||||||||||||||||||||||||||||||||||||||||||||||||||||||||||||||||||||||||||||||||||||||||||||||||||||||||||||||||||||||||||||||||||||||||
|
"In a time of universal deceit, telling the truth is a revolutionary act." G Orwell
|
|||||||||||||||||||||||||||||||||||||||||||||||||||||||||||||||||||||||||||||||||||||||||||||||||||||||||||||||||||||||||||||||||||||||||||||||||||||||||||||||||||||||||||||||||||||||||||||||||||||||||||||||||||||||||||||||||||||||||||||||||||||||||||||||||||||||||||||||||||||||||||||||||||||||||||||||||||||||||||||||||
|
|||||||||||||||||||||||||||||||||||||||||||||||||||||||||||||||||||||||||||||||||||||||||||||||||||||||||||||||||||||||||||||||||||||||||||||||||||||||||||||||||||||||||||||||||||||||||||||||||||||||||||||||||||||||||||||||||||||||||||||||||||||||||||||||||||||||||||||||||||||||||||||||||||||||||||||||||||||||||||||||||
|
TipKat
V.I.P. Member

Joined: April 15 2008 Location: Evanston, IL Status: Offline Points: 316 |
Post Options
Thanks(0)
Quote Reply
Posted: February 20 2011 at 4:25pm |
||||||||||||||||||||||||||||||||||||||||||||||||||||||||||||||||||||||||||||||||||||||||||||||||||||||||||||||||||||||||||||||||||||||||||||||||||||||||||||||||||||||||||||||||||||||||||||||||||||||||||||||||||||||||||||||||||||||||||||||||||||||||||||||||||||||||||||||||||||||||||||||||||||||||||||||||||||||||||||||||
|
|||||||||||||||||||||||||||||||||||||||||||||||||||||||||||||||||||||||||||||||||||||||||||||||||||||||||||||||||||||||||||||||||||||||||||||||||||||||||||||||||||||||||||||||||||||||||||||||||||||||||||||||||||||||||||||||||||||||||||||||||||||||||||||||||||||||||||||||||||||||||||||||||||||||||||||||||||||||||||||||||
|
Mahshadin
Admin Group
Joined: January 26 2006 Location: United States Status: Offline Points: 3882 |
Post Options
Thanks(0)
Quote Reply
Posted: March 05 2011 at 1:29pm |
||||||||||||||||||||||||||||||||||||||||||||||||||||||||||||||||||||||||||||||||||||||||||||||||||||||||||||||||||||||||||||||||||||||||||||||||||||||||||||||||||||||||||||||||||||||||||||||||||||||||||||||||||||||||||||||||||||||||||||||||||||||||||||||||||||||||||||||||||||||||||||||||||||||||||||||||||||||||||||||||
Warm Arctic, Cold ContinentsChanges in the Arctic Are Hitting Closer to HomeIt's a puzzle: How could warmth in the Arctic produce frigid conditions elsewhere?
 The low Arctic pressure field is shown by purple colors in the figure for December 1968–1996. Strong Polar Vortex winds circle this pressure field, trapping cold air in the Arctic regions. In December 2009, this pattern broke down, Polar Vortex winds weakened (green colors) and cold Arctic air (which parallels the color contours) flowed southward. (Credit: NOAA)
NOAA scientists may have a clue.
Extremely cold winds have swept down through the Northern Hemisphere recently, reaching as far south as the state of Florida and causing record low temperatures in January. The unusually cold winter of 2009-2010 - which saw massive snowstorms dubbed "Snowpocalypse" and "Snowmageddon" - and the frigid start to 2011 in the eastern United States and Europe have scientists talking about what might be influencing the weather. Dr. James Overland, a scientist at NOAA's Pacific Marine Environmental Laboratory (PMEL) in Seattle, has been studying the changing conditions in the Arctic for 30 years. He explains why the deterioration of the Polar Vortex could be leading to some of these extreme winter weather events. "When the Polar Vortex - a ring of winds circling the Arctic - breaks down, this allows cold air to spill south, affecting the eastern United States and other regions," says Dr. Overland. "This can result in a warmer-than-average Arctic region and colder temperatures that may include severe winter weather events on the North American and European continents." A Polar Vortex link to Winter 2009-2010? "In December 2009, the Arctic was 9 degrees F warmer than normal, and mid-latitude continents were 9 degrees F cooler than normal, with record cold and snow conditions in northern Europe, eastern Asia and eastern North America," says Dr. Overland. "This is the Warm Arctic-Cold Continents pattern. The winter of 2009-2010 had especially extreme weather in the U.S. as moisture from El Nino hit cold air from the Arctic."  A map of the Warm Arctic-Cold Continents pattern for December 2010 shows warmer than usual air temperature (red) in the Arctic, especially for regions that were sea-ice-free in summer - north of Alaska, Hudson Bay and in the Barents Sea. Cold continents (purple) are seen where Arctic air has penetrated southward. (Credit: NOAA) Why are we seeing these changes now? According to the 2010 Arctic Report Card, there is reduced sea summer sea ice cover, record snow cover decreases, and record temperatures. Could these changes be linked to the weakened Polar Vortex and extreme winter weather events? Many factors, including natural climate variability, can produce extreme weather events. But, there also is a potential impact from Arctic regions, where solar heat absorbed by recently ice-free regions of the ocean warms the atmosphere during autumn, impacting the winds. More research is needed to study the causes and extent of the recently observed Warm Arctic-Cold Continent pattern. The North Atlantic Oscillation (NAO) is a natural climate pattern that is the dominant mode of winter climate variability for the region, which ranges from central North America to Europe and into Northern Asia. A strongly negative NAO can indicate a breakdown of the Polar Vortex. Last winter, there were two extreme cold continent events � and the breakdown of the Vortex, as measured by the NAO, was the most extreme on record for the past 145 years. Undoubtedly, changes in the Arctic are being felt near and far. The winters of 2009 and 2010 serve as a jumping off point for more research to determine potential linkages between Arctic changes and continental weather to help predict if the Northern latitudes will witness colder winters in the future as more summer sea ice is lost. |
|||||||||||||||||||||||||||||||||||||||||||||||||||||||||||||||||||||||||||||||||||||||||||||||||||||||||||||||||||||||||||||||||||||||||||||||||||||||||||||||||||||||||||||||||||||||||||||||||||||||||||||||||||||||||||||||||||||||||||||||||||||||||||||||||||||||||||||||||||||||||||||||||||||||||||||||||||||||||||||||||
|
"In a time of universal deceit, telling the truth is a revolutionary act." G Orwell
|
|||||||||||||||||||||||||||||||||||||||||||||||||||||||||||||||||||||||||||||||||||||||||||||||||||||||||||||||||||||||||||||||||||||||||||||||||||||||||||||||||||||||||||||||||||||||||||||||||||||||||||||||||||||||||||||||||||||||||||||||||||||||||||||||||||||||||||||||||||||||||||||||||||||||||||||||||||||||||||||||||
|
|||||||||||||||||||||||||||||||||||||||||||||||||||||||||||||||||||||||||||||||||||||||||||||||||||||||||||||||||||||||||||||||||||||||||||||||||||||||||||||||||||||||||||||||||||||||||||||||||||||||||||||||||||||||||||||||||||||||||||||||||||||||||||||||||||||||||||||||||||||||||||||||||||||||||||||||||||||||||||||||||
|
Mahshadin
Admin Group
Joined: January 26 2006 Location: United States Status: Offline Points: 3882 |
Post Options
Thanks(0)
Quote Reply
Posted: March 24 2011 at 6:41pm |
||||||||||||||||||||||||||||||||||||||||||||||||||||||||||||||||||||||||||||||||||||||||||||||||||||||||||||||||||||||||||||||||||||||||||||||||||||||||||||||||||||||||||||||||||||||||||||||||||||||||||||||||||||||||||||||||||||||||||||||||||||||||||||||||||||||||||||||||||||||||||||||||||||||||||||||||||||||||||||||||
February Ranked 17th Warmest on RecordMarch 15, 2011 This year, the globe experienced the 17th warmest February since record keeping began in 1880, as the climate phenomenon La Nina continued to be a significant factor. Last month's average Arctic sea ice extent tied with 2005 as the smallest extent for February in its 32-year period of record. The monthly analysis from NOAA's National Climatic Data Center is part of the suite of climate services NOAA provides government, business and community leaders so they can make informed decisions. Global Temperature Highlights - February
Global Temperature Highlights - December 2010 - February 2011
Polar Sea Ice and Precipitation Highlights
http://www.noaanews.noaa.gov/stories2011/20110315_globalstats.html |
|||||||||||||||||||||||||||||||||||||||||||||||||||||||||||||||||||||||||||||||||||||||||||||||||||||||||||||||||||||||||||||||||||||||||||||||||||||||||||||||||||||||||||||||||||||||||||||||||||||||||||||||||||||||||||||||||||||||||||||||||||||||||||||||||||||||||||||||||||||||||||||||||||||||||||||||||||||||||||||||||
|
"In a time of universal deceit, telling the truth is a revolutionary act." G Orwell
|
|||||||||||||||||||||||||||||||||||||||||||||||||||||||||||||||||||||||||||||||||||||||||||||||||||||||||||||||||||||||||||||||||||||||||||||||||||||||||||||||||||||||||||||||||||||||||||||||||||||||||||||||||||||||||||||||||||||||||||||||||||||||||||||||||||||||||||||||||||||||||||||||||||||||||||||||||||||||||||||||||
|
|||||||||||||||||||||||||||||||||||||||||||||||||||||||||||||||||||||||||||||||||||||||||||||||||||||||||||||||||||||||||||||||||||||||||||||||||||||||||||||||||||||||||||||||||||||||||||||||||||||||||||||||||||||||||||||||||||||||||||||||||||||||||||||||||||||||||||||||||||||||||||||||||||||||||||||||||||||||||||||||||
|
Mahshadin
Admin Group
Joined: January 26 2006 Location: United States Status: Offline Points: 3882 |
Post Options
Thanks(0)
Quote Reply
Posted: April 16 2011 at 9:39am |
||||||||||||||||||||||||||||||||||||||||||||||||||||||||||||||||||||||||||||||||||||||||||||||||||||||||||||||||||||||||||||||||||||||||||||||||||||||||||||||||||||||||||||||||||||||||||||||||||||||||||||||||||||||||||||||||||||||||||||||||||||||||||||||||||||||||||||||||||||||||||||||||||||||||||||||||||||||||||||||||
Earth had 13th warmest March on recordApril 14, 2011 The Earth experienced the 13th warmest March since record keeping began in 1880, as the climate phenomenon La Ni�a continued to be a significant factor. The annual maximum Arctic sea ice extent was reached on March 7 and tied with 2006 as the smallest annual maximum extent since record keeping began in 1979. The monthly analysis from NOAA�s National Climatic Data Center is part of the suite of climate services NOAA provides government, business and community leaders so they can make informed decisions. Global temperature highlights � March
Global temperature highlights � year-to-date (January through March)
Polar sea ice and precipitation highlights
http://www.noaanews.noaa.gov/stories2011/20110414_globalstats.html ________________________________________________________________________________________
USA Only (March)
|
|||||||||||||||||||||||||||||||||||||||||||||||||||||||||||||||||||||||||||||||||||||||||||||||||||||||||||||||||||||||||||||||||||||||||||||||||||||||||||||||||||||||||||||||||||||||||||||||||||||||||||||||||||||||||||||||||||||||||||||||||||||||||||||||||||||||||||||||||||||||||||||||||||||||||||||||||||||||||||||||||
|
"In a time of universal deceit, telling the truth is a revolutionary act." G Orwell
|
|||||||||||||||||||||||||||||||||||||||||||||||||||||||||||||||||||||||||||||||||||||||||||||||||||||||||||||||||||||||||||||||||||||||||||||||||||||||||||||||||||||||||||||||||||||||||||||||||||||||||||||||||||||||||||||||||||||||||||||||||||||||||||||||||||||||||||||||||||||||||||||||||||||||||||||||||||||||||||||||||
|
|||||||||||||||||||||||||||||||||||||||||||||||||||||||||||||||||||||||||||||||||||||||||||||||||||||||||||||||||||||||||||||||||||||||||||||||||||||||||||||||||||||||||||||||||||||||||||||||||||||||||||||||||||||||||||||||||||||||||||||||||||||||||||||||||||||||||||||||||||||||||||||||||||||||||||||||||||||||||||||||||
|
Mahshadin
Admin Group
Joined: January 26 2006 Location: United States Status: Offline Points: 3882 |
Post Options
Thanks(0)
Quote Reply
Posted: May 31 2011 at 2:41pm |
||||||||||||||||||||||||||||||||||||||||||||||||||||||||||||||||||||||||||||||||||||||||||||||||||||||||||||||||||||||||||||||||||||||||||||||||||||||||||||||||||||||||||||||||||||||||||||||||||||||||||||||||||||||||||||||||||||||||||||||||||||||||||||||||||||||||||||||||||||||||||||||||||||||||||||||||||||||||||||||||
April was seventh warmest on recordMay 16, 2011 The Earth experienced the seventh warmest April since record keeping began in 1880, as the climate phenomenon La Nina continued to be a significant factor. April's annual Arctic sea ice extent was the fifth smallest since record keeping began in 1979, while the Antarctic sea ice extent was the fourth smallest. The monthly analysis from NOAA's National Climatic Data Center in Asheville, N.C., is part of the suite of climate services NOAA provides government, business and community leaders so they can make informed decisions. Global Temperature Highlights - April
Global Temperature Highlights - Year-to-date
Polar Sea Ice and Precipitation Highlights
http://www.noaanews.noaa.gov/stories2011/20110516_globalstats.html |
|||||||||||||||||||||||||||||||||||||||||||||||||||||||||||||||||||||||||||||||||||||||||||||||||||||||||||||||||||||||||||||||||||||||||||||||||||||||||||||||||||||||||||||||||||||||||||||||||||||||||||||||||||||||||||||||||||||||||||||||||||||||||||||||||||||||||||||||||||||||||||||||||||||||||||||||||||||||||||||||||
|
"In a time of universal deceit, telling the truth is a revolutionary act." G Orwell
|
|||||||||||||||||||||||||||||||||||||||||||||||||||||||||||||||||||||||||||||||||||||||||||||||||||||||||||||||||||||||||||||||||||||||||||||||||||||||||||||||||||||||||||||||||||||||||||||||||||||||||||||||||||||||||||||||||||||||||||||||||||||||||||||||||||||||||||||||||||||||||||||||||||||||||||||||||||||||||||||||||
|
|||||||||||||||||||||||||||||||||||||||||||||||||||||||||||||||||||||||||||||||||||||||||||||||||||||||||||||||||||||||||||||||||||||||||||||||||||||||||||||||||||||||||||||||||||||||||||||||||||||||||||||||||||||||||||||||||||||||||||||||||||||||||||||||||||||||||||||||||||||||||||||||||||||||||||||||||||||||||||||||||
|
Mahshadin
Admin Group
Joined: January 26 2006 Location: United States Status: Offline Points: 3882 |
Post Options
Thanks(0)
Quote Reply
Posted: June 06 2011 at 9:00pm |
||||||||||||||||||||||||||||||||||||||||||||||||||||||||||||||||||||||||||||||||||||||||||||||||||||||||||||||||||||||||||||||||||||||||||||||||||||||||||||||||||||||||||||||||||||||||||||||||||||||||||||||||||||||||||||||||||||||||||||||||||||||||||||||||||||||||||||||||||||||||||||||||||||||||||||||||||||||||||||||||
Higher Density Means World Forests Are Capturing More CarbonScienceDaily (June 6, 2011) - Forests in many regions are becoming larger carbon sinks thanks to higher density, U.S. and European researchers say in a new report. In Europe and North America, increased density significantly raised carbon storage despite little or no expansion of forest area, according to the study, led by Aapo Rautiainen of the University of Helsinki, Finland, and published in the online, open-access journal PLoS ONE.
Even in the South American nations studied, more density helped maintain regional carbon levels in the face of deforestation. The researchers analyzed information from 68 nations, which together account for 72 percent of the world's forested land and 68 percent of reported carbon mass. They conclude that managing forests for timber growth and density offers a way to increase stored carbon, even with little or no expansion of forest area. "In 2004 emissions and removals of carbon dioxide from land use, land-use change and forestry comprised about one fifth of total emissions. Tempering the fifth by slowing or reversing the loss of carbon in forests would be a worthwhile mitigation. The great role of density means that not only conservation of forest area but also managing denser, healthier forests can mitigate carbon emission," says Rautiainen. Co-author Paul E. Waggoner, a forestry expert with Connecticut's Agricultural Experiment Station, says remote sensing by satellites of the world's forest area brings access to remote places and a uniform method. "However, to speak of carbon, we must look beyond measurements of area and apply forestry methods traditionally used to measure timber volumes." "Forests are like cities -- they can grow both by spreading and by becoming denser," says co-author Iddo Wernick of The Rockefeller University's Program for the Human Environment. The authors say most regions and almost all temperate nations have stopped losing forest and the study's findings constitute a new signal of what co-author Jesse Ausubel of Rockefeller calls "The Great Reversal" under way in global forests after centuries of loss and decline. "Opportunities to absorb carbon and restore the world's forests can come through increasing density or area or both." To examine how changing forest area and density affect timber volume and carbon, the study team first focused on the United States, where the U.S. Forest Service has conducted a continuing inventory of forest area, timberland area and growing stock since 1953. They found that while U.S. timberland area grew only 1 percent between 1953 and 2007, the combined national volume of growing stock increased by an impressive 51 percent. National forest density increased substantially. For an international perspective, the research team examined the 2010 Global Forest Resources Assessment compiled by the UN Food and Agriculture Organization (FAO), which provides consistent figures for the years 1990 to 2010. The data reveal uncorrelated changes of forest area and density. Countries in Africa and South America, which lost about 10 percent of their forest area over the two decades, lost somewhat less carbon, indicating a small rise in forest density. In Asia during the second decade of the study period, density rose in 10 of the region's 21 countries. Indonesia's major loss of density and sequestered carbon, however, offset any gain in carbon storage in other Asian nations. Europe, like the U.S., demonstrated substantial density gains, adding carbon well in excess of the estimated carbon absorbed by the larger forested area. Says study co-author Pekka Kauppi, of the University of Helsinki, Finland, "With so much bad news available on World Environment Day, we are pleased to report that, of 68 nations studied, forest area is expanding in 45 and density is also increasing in 45. Changing area and density combined had a positive impact on the carbon stock in 51 countries." |
|||||||||||||||||||||||||||||||||||||||||||||||||||||||||||||||||||||||||||||||||||||||||||||||||||||||||||||||||||||||||||||||||||||||||||||||||||||||||||||||||||||||||||||||||||||||||||||||||||||||||||||||||||||||||||||||||||||||||||||||||||||||||||||||||||||||||||||||||||||||||||||||||||||||||||||||||||||||||||||||||
|
"In a time of universal deceit, telling the truth is a revolutionary act." G Orwell
|
|||||||||||||||||||||||||||||||||||||||||||||||||||||||||||||||||||||||||||||||||||||||||||||||||||||||||||||||||||||||||||||||||||||||||||||||||||||||||||||||||||||||||||||||||||||||||||||||||||||||||||||||||||||||||||||||||||||||||||||||||||||||||||||||||||||||||||||||||||||||||||||||||||||||||||||||||||||||||||||||||
|
|||||||||||||||||||||||||||||||||||||||||||||||||||||||||||||||||||||||||||||||||||||||||||||||||||||||||||||||||||||||||||||||||||||||||||||||||||||||||||||||||||||||||||||||||||||||||||||||||||||||||||||||||||||||||||||||||||||||||||||||||||||||||||||||||||||||||||||||||||||||||||||||||||||||||||||||||||||||||||||||||
|
Mahshadin
Admin Group
Joined: January 26 2006 Location: United States Status: Offline Points: 3882 |
Post Options
Thanks(0)
Quote Reply
Posted: June 08 2011 at 4:03pm |
||||||||||||||||||||||||||||||||||||||||||||||||||||||||||||||||||||||||||||||||||||||||||||||||||||||||||||||||||||||||||||||||||||||||||||||||||||||||||||||||||||||||||||||||||||||||||||||||||||||||||||||||||||||||||||||||||||||||||||||||||||||||||||||||||||||||||||||||||||||||||||||||||||||||||||||||||||||||||||||||
|
|||||||||||||||||||||||||||||||||||||||||||||||||||||||||||||||||||||||||||||||||||||||||||||||||||||||||||||||||||||||||||||||||||||||||||||||||||||||||||||||||||||||||||||||||||||||||||||||||||||||||||||||||||||||||||||||||||||||||||||||||||||||||||||||||||||||||||||||||||||||||||||||||||||||||||||||||||||||||||||||||
| Year | Fatalities |
|---|---|
| 1925 | 794 |
| 1936 | 552 |
| 1917 | 551 |
| 1927 | 540 |
| 1896 | 537 |
| 2011 (through June 7th) |
525 |
| 1953 | 519 |
| 1920 | 499 |
| 1908 | 477 |
| 1909 | 404 |
On the January-May timescale, the number of tornadoes and the number of tornado-related fatalities were record breaking. It is likely that the entire country and many states will approach and/or break records for the number of confirmed tornadoes. For the year-to-date period, there were 1,398 preliminary tornado reports nationwide, with the confirmed number likely to be around 900, assuming a confirmation rate similar to the historical average. Nationwide, the previous January-May tornado count record was 1,011 in 2008. The 2011 January-May tornado count will likely rank as the second most since modern records began in 1950. In terms of the number of tornado-related fatalities, there were 525 during the January-May period. When analyzing the number of tornado-related fatalities, there were two separate comparisons — the comparison to the modern (1950-present) tornado record and the non-official (1875-present) record. The 525 fatalities is the most in the 1950-present period,and the sixth in the 1875-present time period.
The severe weather outbreaks during spring 2011 caused significant property damage across the eastern United States on top of the unfortunate high number of fatalities. According to preliminary numbers from various disaster cost modeling and insurance risk reports, the estimated damage from the spring severe weather outbreaks will approach 13.25 billion U.S. dollars. There were potentially four severe weather events that will exceed one billion U.S. dollars in damage each.
A major severe weather outbreak impacted the southeastern U.S. between April 14th and 16th. A strong upper level low pressure system moved across the central plains, and ahead of the system, very warm and very moist air was advected northward from the Gulf of Mexico. As the associated surface cold front moved into the southeast, a series of severe thunderstorm complexes were initiated across the country. Over the course of the three days, there were 329 preliminary tornado reports across 16 states. NOAA estimates the final tornado count for the outbreak will be around 160 tornadoes, marking one of the largest outbreaks on record, especially for April, which averages 135 tornadoes for the entire month. Although there were a large number of tornadoes, there were 14 tornadoes rated EF-3, and none were rated EF-4 or EF-5. A total of 38 people were killed from the tornadoes, 22 of which were in North Carolina alone. Nationwide, the tornado outbreak break was the deadliest since the 2008 Super Tuesday tornado outbreak that occurred on February 5th and 6th, 2008, when 57 people were killed. The 30 confirmed tornadoes across North Carolina broke the single-storm and single-day tornado outbreak record for the state. The previous record was from the infamous March 1984 Carolina’s tornado outbreak when 22 tornadoes killed 42 people in the state.
| Date | Fatality Reports |
|---|---|
| March 18, 1925 | 747 |
| March 21, 1932 | 332 |
| May 17, 1849 | 317 |
| April 27, 2011 | 314 |
| April 3, 1974 | 310 |
| May 27, 1896 | 305 |
| April 11, 1965 | 260 |
| April 5, 1936 | 249 |
Another major and record breaking severe weather outbreak impacted the southeastern U.S. between April 25th and 28th. During the outbreak, there were 434 preliminary tornado reports in 21 states. The NOAA estimate of actual tornadoes for the four day period is 305 (as more complete data become available this number will be revised). The storm scenario was similar to the mid-April outbreak, with a potent upper level low pressure system moving across the Central and Northern Plains, but this low pressure system was a little stronger and had a path more northward. Ahead of the surface cold front, very warm and very moist air infiltrated the southern U.S. from the Gulf of Mexico. Temperatures across the southeast reached into the lower 90s (°F). A strong mid-level jet streak moved into the Tennessee Valley, providing strong shear and dynamic support for severe thunderstorm development. As the storm system moved towards the east, it initiated severe weather each day between the 25th and 28th. The most impressive period of the outbreak was on April 27th, and into the early hours of the 28th, when two severe weather complexes moved across Mississippi, Alabama, Tennessee, and Georgia. NOAA’s current estimate is there were 190 tornadoes during that time period. The previous single largest tornado outbreak to impact the U.S. was the April 3-4, 1974 Super Outbreak, when there were 148 tornadoes across the Southeast and Ohio Valley. According to the most recent estimates, there were 3 EF-5 rated tornadoes, 12 EF-4s and 21 EF-3s. There were an estimated 320 tornado related fatalities from the outbreak — approximately 314 of those occurred on the 27th. Alabama alone observed 235 of those fatalities. An EF-5 moved through northern Alabama and killed 78 people, the deadliest of the outbreak. Several major metropolitan areas were directly impacted by strong tornadoes including Tuscaloosa, Birmingham, and Huntsville in Alabama and ******tanooga, Tennessee, causing the estimated damage costs to sore. According to preliminary information, property damages might exceed six billion U.S. dollars. For more information see the monthly U.S. Tornado State of the Climate report.
| City | April 27th Hourly Average Dewpoint | 30-year average April Dewpoint |
|---|---|---|
| Birmingham, Alabama | 66.2 °F (19.0 °C) | 49.2 °F (9.5 °C) |
| Tuscaloosa, Alabama | 66.0 °F (18.9 °C) | 50.9 °F (10.5 °C) |
| Huntsville, Alabama | 61.9 °F (16.6 °C) | 48.3 °F (9.1 °C) |
| Tornado | Fatalities | Date |
|---|---|---|
| Tri-State (Missouri/Illinois/Indiana) |
695 | March 18, 1925 |
| Natchez, Mississippi | 317 | May 6, 1840 |
| St. Louis, Missouri | 255 | May 27, 1896 |
| Tupelo, Mississippi | 216 | April 5, 1936 |
| Gainesville, Georgia | 203 | April 6, 1936 |
| Woodward, Oklahoma | 181 | April 9, 1947 |
| Amite, Louisiana/ Purvis, Mississippi |
143 | April 24, 1908 |
| Joplin, Missouri | 141 (est.) | May 22, 2011 |
| New Richmond, Wisconsin | 117 | June 12, 1899 |
| Flint, Michigan | 116 | June 8, 1953 |
On May 22nd a severe weather outbreak occurred across the central Plains and the Midwestern United States, and several of the storms generated tornadoes across the region. The most destructive of the storms tracked from southeastern Kansas into southwestern Missouri during the late afternoon. This supercell thunderstorm spawned a strong tornado over Joplin, Missouri, resulting in devastating damage. The National Weather Service rated the tornado an EF-5, with winds in excess of 200 mph (320 km/hr). The tornado was on the ground for approximately 6 miles (9.7km) and had a maximum width of 3/4 mile (1.2 km). The tornado struck the heavily populated southern part of Joplin, resulting in at least 141 deaths and 1,000 injuries. The tornado surpassed the June 1953 tornado which killed 116 people in Flint, Michigan as the deadliest single tornado to strike the U.S. since modern tornado record keeping began in 1950. The deadliest tornado on record for the U.S. was the 'Tri-State Tornado' which killed 695 people across Missouri, Illinois, and Indiana in March 1925.


The image on the left shows the base level reflectivity from the Springfield, Missouri NEXRAD radar site of the Joplin, Missouri tornado Sunday May 22, 2011 22:43 GMT (5:43 pm local time). The high reflectivity values occurring over southern Joplin indicate the mostly likely location of the EF-5 tornado.
The image on the right shows de-aliased storm relative velocity from the Springfield, Missouri NEXRAD radar site of the Joplin, Missouri tornado Sunday May 22, 2011 22:43 GMT (5:43 pm local time). Green colors (negative values) indicate wind moving towards the radar site (located 60 miles [97km] to the east), and red colors (positive values) indicate winds moving away from the radar site. The tight couplet of reds and greens over southern Joplin show the strong rotation occurring within the EF-5 tornado. The large scale green and red couplet indicates the larger scale rotation occurring within the supercell thunderstorm.

Images created with NCDC's Weather and Climate Toolkit and GRLevel2.
| State | 2011 Preliminary Tornado Reports* | Old Record / Year |
|---|---|---|
| Alabama | 160 | 94 / 2008 |
| Kentucky | 52 | 39 / 1997 |
| Mississippi | 136 | 109 / 2008 |
| North Carolina | 89 | 67 / 2004 |
| Tennessee | 75 | 46 / 2009 |
| State | 2011 Preliminary Tornado Reports* | Old Record / Year |
|---|---|---|
| Alabama | 160 | 72 / 2009 |
| Arkansas | 66 | 62 / 2008 |
| Georgia | 56 | 49 / 2008 |
| Indiana | 48 | 46 / 1990 |
| Kentucky | 52 | 34 / 2008, 1974, 2003 |
| Louisiana | 70 | 44 / 1990 |
| Maryland | 14 | 13 / 2002 |
| Mississippi | 136 | 56 / 2008 |
| Misssouri | 85-tie | 85 / 2003 |
| North Carolina | 89 | 53 / 1998 |
| Ohio | 31 | 28 / 1973 |
| Tennessee | 94 | 45 / 2003 |
| Virginia | 38 | 33 / 2008 |
| Wisconsin | 35 | 33 / 2005 |
| Entire U.S. | 1371 | 1,224 / 2008 |
| State | 2011 Preliminary Tornado Reports* | Old Record / Year |
|---|---|---|
| Alabama | 140 | 35 / 2009 |
| Arkansas | 46 | 29 / 1979 |
| Georgia | 46 | 25 / 2009 |
| Kentucky | 41 | 29 / 1974 |
| Louisiana | 36 | 24 / 2000 |
| Maryland | 11 | 5 / 2002 |
| Mississippi | 121 | 26 / 2005 |
| Misssouri | 30 | 26 / 1994 |
| Nevada | 3 | 1 / 2005, 1964, 2001 |
| New York | 8 | 4 / 1991 |
| North Carolina | 85 | 24 / 1996 |
| Tennessee | 50 | 42 / 1974 |
| Texas | 69 - tie | 69 / 1957 |
| Virginia | 35 | 18 / 2008 |
| Wisconsin | 16 | 11 / 1984 |
| Entire U.S. | 875 | 273 / 1974 |
*2011 numbers reported are preliminary tornado reports. These numbers are subject to change as more up-to-date storm surveys are completed.
During the spring of 2011, persistent rainfall combined with melting snowpack caused historical flooding in some of the United States' major rivers, including the Ohio, the Mississippi, and the Missouri. A relentless storm track pattern provided nearly 300 percent of normal precipitation amounts in the Ohio Valley. As the Ohio, Missouri, and Mississippi River experienced historical crests, dams and levees were breached. Those that were not breached were significantly tested throughout the enduring event. Smaller towns and farmland were intentionally flooded to save larger, more populated towns. While the slow-moving disaster provided extra lead time for the residents to prepare their homes and businesses, hundreds of thousands of acres of farmland from an area south of the Great Lakes to the Gulf Coast were swimming in 20 feet (6 m) of water for weeks.

The Lower Mississippi Basin begins at the confluence of the Ohio and Upper Mississippi Rivers in Cairo, Illinois. According to the U.S. Army Corps of Engineers, 4 million people reside within the 35,000 square mile Lower Mississippi watershed. After a massive flood overwhelmed the southernmost stretch the river in 1927, the Army Corps of Engineers built a 2,200-mile system of earthen levees, floodwalls and other controls along the Mississippi, Arkansas, and Red Rivers. The flood control system has been tested over the years, especially in 1973 and 1993 when extremely wet conditions swelled the rivers to comparable historical levels. In 2011, extreme amounts of precipitation led to unprecedented flooding in several locations along the major rivers.
The extreme amounts of precipitation was set up by a large-scale weather pattern during April which consisted of high pressure, which typically results in warm dry air, over the South and Southwest U.S. This high pressure was associated with a ridge which inhibited systems from entering the region deflecting storms into the Ohio River Valley region. The persistence of this pattern during the season exacerbated the magnitude of the precipitation amounts and subsequent flooding.
During the month of April, over 1,300 daily precipitation records were broken across the Midwest and South - 197 in Kentucky alone. For the month, 72 locations reported their wettest day in any April on record and 5 of these stations set a new all-time record for the wettest 24-hour period for any month. Rainfall totals for April exceeded 13 inches (330 mm) in cities along the Ohio River. At Louisville International Airport, the 13.97 inches (355 mm) surpassed the previous record of 11.10 inches (282 mm) set in 1970. A monthly record of 13.52 inches (343 mm) of precipitation was also a record in Cincinnati. Further inland, the 15.91 inches (404 mm) of precipitation in Paducah, Kentucky was also an April record. The 12.7 inches (329 mm) that was measured in Lexington surpassed the 1970 record of 9.3 inches (236 mm). Columbus, Ohio received 7.14 inches (181 mm) of precipitation which was also a record. The 6.89 inches (175 mm) that fell in Cleveland broke the 1961 record of 6.61 inches (168 mm). From March-May, departures were at least 150 percent of normal in an area that stretched from the Ohio Valley to the Middle Mississippi Valley.
| Location | Record | Amount | Previous Record (year) |
|---|---|---|---|
| Northwest Climate Region | Most March–May Precipitation | 10.10" | 9.39" (1993) |
| Washington | Most March–May Precipitation | 13.67" | 12.85" (1997) |
| Wyoming | Most March–May Precipitation | 6.69" | 6.41" (1906) |
| Indiana | Most March–May Precipitation | 19.38" | 18.05" (1933) |
| Ohio | Most March–May Precipitation | 17.47" | 16.22" (1964) |
| Kentucky | Most March–May Precipitation | 23.70" | 22.08" (1935) |
| West Virginia | Most March–May Precipitation | 18.19" | 17.11" (1967) |
| Pennsylvania | Most March–May Precipitation | 18.62" | 15.48" (1983) |
| New York | Most March–May Precipitation | 16.14" | 14.35" (1983) |
| Vermont | Most March–May Precipitation | 17.18" | 16.94" (1983) |
In order to protect heavily populated cities from flooding, the Army Corps of Engineers opened several spillways along the Lower Mississippi River. On May 2 officials intentionally breached part of the Birds Point-New Madrid Levee near the confluence of the Ohio and Mississippi Rivers to protect the small Illinois town of Cairo, population of 2,800. The two-mile opening allowed water to pass through at a rate eight times that of Niagara Falls, flooding the Birds Point New-Madrid Floodway - which is 130,000 acres of Missouri farmland in addition to about 100 residences. The move was challenged in courts, but overturned, preventing devastating flooding in Cairo and elsewhere downstream. The Corps estimated it will take up to two months for the water to recede from the floodway and another month for the land to dry out.
One week later on May 9, the Bonnet Carre' Spillway was opened, allowing flood waters to flow into Lake Pontchartrain. When all 350 bays are opened in that spillway, it diverts 250,000 cubic feet (7,079 cubic meters) of water per second into Lake Pontchartrain and on into the Gulf. The last time all Bonnet Carre' bays were opened was in 1983. Farther upstream, a portion Morganza Spillway was opened on May 14. This move alleviated stress on the Old River Control Structure upstream and the levees which protect New Orleans downstream. The only prior time the Morganza Spillway had been opened was in 1973 and this marked the first time in history that all three spillways have been opened simultaneously.

Even with all the precautions taken, the populated cities and rich farmland along the riverside, which are normally protected by the system of levees, were flooded. The massive wall of water drifted slowly southward, overtopping its banks along the way. In Memphis, Tennessee on May 10, the Mississippi River crested at 47.9 feet (14.6 m), the highest level reached at Memphis since 1937 (48.7 feet or 14.8 m). In Greenville, Mississippi, the river crested on May 16, about one foot below the historical crest of 65.4 feet (19.9 m) set in 1927. The 2011 flood set a record in Vicksburg, Mississippi, cresting on May 18 at 57.1 feet (17.4 m) , besting the previous record of 56.2 feet (17.1 m) set in 1927. The flooded Mississippi also caused the Yazoo River to backfill, flooding out Yazoo City, Mississippi where some of the worst flooding occurred. Flood stage is 29 feet (8.9 m), but the crest reached 38.7 feet (11.8 m), just a few feet shy of the record set in 1927 of 43.4 feet (13.2 m).

Another stage height record was set farther downstream in Natchez, Mississippi on May 19. The crest was nearly 4 feet (1.2 m) higher than the previous record of 58.04 feet (17.7 m) set in 1937. To the south of Baton Rouge is the Atchafalaya Basin which, according to the U.S. Geological Survey, is the largest swamp in the United States. When the Morganza Spillway was opened as much as 1.2 million gallons of water per second flooded into the basin encroaching upon Morgan City which is perched on the banks of the Atchafalaya River. The river gauge at the riverside city, home to nearly 13,000, experienced its maximum peak at 10.35 feet (3.2 m) on May 29, just shy of the record of 10.53 feet (3.2 m) set in 1973.
Due to drastic steps of the Army Corps of Engineers that sacrificed farmland and less populated cities, major flooding was averted in the more populated cities along the southernmost sections of the Mississippi River. While the slow surge of water had dispersed some by the time it made it to Baton Rouge (flood stage is 35 feet or 10.7 m) and New Orleans (flood stage is 17 feet or 5.2 m), low-lying areas were still affected. The crest at Baton Rouge was more than 3 feet (0.9 m) below its record level and it was 5 feet (1.5 m) below the record level in New Orleans.
Additional flooding occurred later in the spring and into the summer along the Missouri River. The Missouri River is the longest river in North America and one of the largest tributaries of the Mississippi. Its headwaters begin in Montana and flow through several major cities including: Great Falls, Montana; Williston and Bismarck, North Dakota; Omaha, Nebraska and Kansas City, Missouri before joining with the Mississippi in St Louis, Missouri.
Record amounts of precipitation and melting snowpack contributed to historical flooding along the Missouri and its tributaries. The average rainfall across the state of Wyoming, which hosts several tributaries of the Missouri, was the most for any spring, based on records that data back to 1895. In eastern Montana, precipitation was 300 percent of normal for the month of May. The Missouri River basin experienced its fourth wettest spring and its third wettest May on record.
In Wyoming and Montana, for the month of May, a total 14 locations set precipitation records and seven locations set a new all-time record for the wettest 24-hour period for any month on record. In Glasgow, Montana, the monthly precipitation amount of 6.97 inches (177 mm) was a record in addition to the seasonal snowfall record of 108.6 inches (276 cm). This shattered the previous snowfall record of 70.7 inches (180 cm) set in 2006/2007. During the July 1 - June 30 snow season, Williston, North Dakota received a record 107.2 inches (272 cm) of snow. The previous record was 94.7 inches (241 cm) set during the 1895-1896 season. Record to near-record snowpack in the Northern Rockies and High Plains during the winter and spring contributed to high levels of runoff. The runoff quickly filled all six of the rivers reservoirs forcing the Corps of Engineers to release them. The swollen river breached levees, forcing mandatory evacuations downstream. Additional damaging flooding is expected to continue through early summer.
Flooding was not confined to just rivers and streams. Water levels at Lake Champlain, which straddles New York, Vermont, and Canada, also experienced historical crests. At Rouses Point, Vermont, water levels rose to 102.8 feet (31.3 m) on May 10 and remained at or near historical levels for several weeks. The previous record lake level was 102.1 feet (31.1 m) set in 1869 and the normal for this time of year is about 97 feet (29.6 m). Record amounts of rainfall and melting of winter snowpack in the state exacerbated the flooding. It was the wettest Spring on record in Vermont. In Burlington, it was the wettest May on record with 8.67 inches (220 mm) of precipitation - besting the previous record of 7.10 inches (180 mm) set in 2006. Warmer-than-normal spring temperatures also increased the melting and runoff of snowpack. In Burlington, 128.4 inches (236 cm) of snow fell this season, 45.3 inches (115 cm) more than normal.
The prolonged flooding during the spring of 2011 that affected the Ohio, Mississippi and Missouri River Valleys draws comparisons to the great floods during the early 20th century. During the fall of 1926, record precipitation amounts resulted in major flooding along the lower Mississippi in the spring of 1927. During the three-month period (March-April), Arkansas, Illinois, and Missouri each had their wettest such period in 117 years of record keeping. It was reported that the flood of 1927 submerged more than 165 million acres, drowning 246 people. Economic losses were estimated at 2.8 billion in 2010 dollars.
During the winter 1937, excessive precipitation during an 11-day period (January 13-24) contributed to flooding along the Ohio River. The state of Kentucky experienced a record 16.13 inches (410 mm) of precipitation in January. Individual locations had as much as 23 inches (584 mm) of precipitation during the month. From January 1-24 percent of normal precipitation in the area was approximately 600 percent of normal. Due to the copious amounts of precipitation, the Ohio River crested in Louisville at 85.4 feet (26 m). The Louisville flood stage is 51 feet (15.5 m). Further downstream in Paducah, the flood stage is 39 feet (11.9 m), but the river crested at 60.6 feet (18.5 m). It was reported that 3.3 billion in 2010 U.S. dollars worth of damage was done from the event.
As a result of a series of heavy snows in the Upper Midwest during the winter of 1972/1973 punctuated by heavy springtime rains in the South, the Mississippi swelled, overtopping its banks during the spring of 1973. Both Tennessee and Wisconsin had their wettest March-April period. Additionally, nearly every state east of the Rockies experienced above normal precipitation. Damages came to an estimated 256 million in 2010 U.S. dollars.
In the summer of 1993 frequent and excessive rainfall in the northern Plains southeastward into the central U.S. saturated soils, filling streams and rivers to capacity. For the summer period, record precipitation fell in Iowa, Illinois, Minnesota, Montana, Nebraska, and the Dakotas. Observed river crests in Iowa and Missouri easily surpassed previous record amounts by several feet. In St. Louis, at the confluence of the Missouri, Illinois and Mississippi rivers, the old record of 43.3 feet (13.2 m) set in 1973 was shattered on August 1, 1993 (49.7 feet or 15.1 m). The Missouri River also inundated towns. In Kansas City, the river set a new stage height of 48.9 feet (14.9 m), topping the old record of 46.2 feet (14.1 m) set in 1951. A total of 20 river gauges set all-time records. The devastating floods of 1993 are currently the costliest flooding disaster in the U.S. as damages neared 23 billion in 2010 U.S. dollars. In addition to the cost, more than 50 people were killed and at least 15 million acres of farmland were flooded. Other effects of the 1993 floods were: halted shipping on the Mississippi and Missouri for nearly two months, ten airports were flooded, all rail traffic in the Midwest was ceased, and both the 1993 and 1994 harvests were lost.
The impacts of the 2011 flooding are far reaching, affecting economic sectors such as: agriculture, fishing, shipping, insurance, refineries, and tourism. Economic losses will take years to recoup. Hundreds of thousands of acres of farmland were flooded, creating a nightmare at a time of year when the growing season is just beginning for many crops. In Tennessee, corn planting has been delayed and the winter wheat crop, which is typically harvested in June, was damaged. It was reported that nearly 900,000 acres of farmland in Mississippi was flooded - roughly 10 percent of all farmland in the state. In Arkansas, it is estimated that the flood waters wiped out 1 million acres of farmland - a staggering number when you consider that the agriculture industry generates 16 billion dollars annually in Arkansas. In all, the floods washed out more than 3.5 million acres of farmland within the Lower Mississippi River Valley.
The dangerous floodwaters shut down river commerce, which would have also caused additional stress on the levees. In addition to river commerce, in eastern Arkansas a 23-mile section of Interstate-40, a major east-west thoroughfare, was closed. Businesses and homes were closed or swept away, leaving many without a job or personal belongings. As the event continues to unfold, estimated economic losses are mounting. Overall, total insured losses currently amount to 2-4 billion dollars.
| Amount | Type |
|---|---|
| $800 million | Agriculture in Mississippi |
| $500 million | Agriculture in Arkansas |
| $320 million | Damage in Memphis, Tennessee |
| $317 million | Agriculture and property in Missouri's Birds Point-New Madrid Spillway |
| $80 million | First 30 days of flood fighting efforts in Louisiana |
Farming was not the only economic sector in the South that was heavily damaged. The amount of fresh water flowing into the Gulf of Mexico caused an imbalance in the ecosystem wiping out the oyster beds which need the salt water to keep their metabolisms in check. The large amounts of fresh water saturated with fertilizers, pesticides and other farming chemicals is expected to flow into the gulf causing a "dead-zone" according to Lt. Col. Mark Jernigan, deputy commander of the New Orleans District of the U.S. Army Corps of Engineers. A dead zone is as area with low oxygen levels caused by the increase of fertilizers which fuels the growth of algae.
It is too early to be able to give an exact figure of the damages done and economic loss of the 2011 flooding. However, we do know that it will take years to recover from the 6.8 million acres that were flooded. The flooding that occurred across the United States in Spring of 2011 will be one of the worst flooding disasters in modern American history.
During March and April, drought and wildfires were the main headline across the Southern Plains of Oklahoma, Texas, and New Mexico. The track of storms from the Rockies into the Central and Northern Plains essentially cut off the Southern Plains from the Gulf of Mexico moisture source. The strong cold fronts and dry lines associated with the upper level troughs, which moved through the center of the country, brought strong winds and dry air into the region. The combination of warm, dry, and windy conditions worsened drought across the region and flamed out-of-control wildfires. The amount of precipitation during April across the Southern Plains stood in stark contrast to the record precipitation across the Ohio Valley, the record floods along the Lower Mississippi River, and the severe weather outbreaks across the Southeast.
Starting in March, and lasting into April, a strong ridge of high pressure consistently setup across the Southern Plains, essentially blocking storms systems from entering the region. This led to Oklahoma and New Mexico having their top ten driest March, and Texas to have its driest March, on record. April brought continued dryness, with below-average precipitation for New Mexico, and Texas had its 5th driest April on record. The abnormally dry conditions stretched back to October 2010 for the region, with the March-April 2011, February-April 2011, and October 2010-April 2011 periods being the driest such periods on record for Texas. Dryness across the southern tier of the U.S. is consistent with conditions expected during a winter La Niña. Under typical La Niña conditions, the jet stream and storm track are further north, leaving the southern U.S. under a ridge of high pressure. These impacts tend to be more pronounced during the winter months of a La Niña, and wane as spring progresses. During 2011, the worst of the dryness occurred later than what is typically expected with La Niña.
During the March-April period little to no rain fell across portions of Texas and New Mexico. At the end of April, many locations had not received any rainfall in over 26 days, and this dry spell continued into May. In El Paso, Texas, May 24th marked the 110th consecutive day without precipitation in the city. This broke the previous record of 109 days set in 2002. The March Texas statewide average precipitation was 0.27 inch (6.86 mm), which is the driest March on record (1895-2011) for the state. The previous record for the state was set in 1971, with a precipitation total of 0.28 inch (7.11 mm). Precipitation totals throughout the state ranged mostly between 0 and 25 percent of normal. In the Trans Pecos climate division, 39 stations reported no precipitation. This was also the case for approximately half of the stations in the Lower Valley and Southern climate divisions. A similar scenario occurred in April, when the Texas statewide average precipitation was only 0.75 inch (19.05 mm), the fifth driest April on record (1895-2011). For the state, the majority of stations in the High Plains, Trans Pecos, Rolling Plains, South Central, Southern and Lower Valley climate divisions reported a precipitation total of 0 inches (0 mm). According to the U.S. Drought Monitor (USDM), drought conditions intensified considerably during the time period. A comparison of the spatial extent of drought at the beginning of March to the beginning of May across Texas and New Mexico can be found in the tables below:
| Week | No Drought | D0-D4 | D1-D4 | D2-D4 | D3-D4 | D4 |
|---|---|---|---|---|---|---|
| March 1, 2011 | 4.99 | 95.01 | 72.91 | 46.34 | 12.72 | 0.00 |
| May 3, 2011 | 0 | 100.00 | 98.86 | 93.99 | 73.73 | 25.96 |
| Week | No Drought | D0-D4 | D1-D4 | D2-D4 | D3-D4 | D4 |
|---|---|---|---|---|---|---|
| March 1, 2011 | 7.79 | 92.21 | 63.97 | 33.32 | 0.00 | 0.00 |
| May 3, 2011 | 0.00 | 100.00 | 96.54 | 87.36 | 61.02 | 13.63 |
Drought indicators across the Southern Plains show that the drought conditions during April were both a short-term and long-term phenomenon. The March Palmer Z index map shows a bull’s eye of severe and extreme short term drought across the Southern Plains and Southwest. Southern Arizona, most of New Mexico, Texas, and southern Oklahoma had the worst short-term drought conditions across the country. Little changed in April — low precipitation and hot temperatures prevailed across the same region. The April Palmer Z Index map shows that the low precipitation and hot temperatures resulted in short-term drought across much of the Southwest and Central to Southern Plains. The areas experiencing the most extreme short-term drought were central and southern New Mexico, stretching across most of Texas and along the western Gulf Coast.
The April 2011 Palmer Hydrological Drought Index (PHDI) map shows that the drought was a long-term phenomenon across most of the southern tier of the country. New Mexico, most of Texas, and northern Louisiana were experiencing severe to extreme drought, according to the PHDI. The Standardized Precipitation Index (SPI) which measures moisture supply also indicates that the dryness across the Southern Plains was both a short-term and long-term phenomenon, back to the 12-month (May 2010-April 2011) timescale, with the most severe dryness occurring in the last six months (November 2010-April 2011) across Texas and New Mexico.
Soil moisture, according to drought monitoring products from the USDA, indicated that the top soil across Texas and New Mexico was dry to very dry, and pasture lands were in poor to very-poor condition during April. Satellite monitoring of vegetation health indicated stress on vegetation across most of the Southern and Central Plains, especially over Texas during the month. According to May 1 USDA reports, roughly three-fourths of the pasture and rangeland in New Mexico and Texas was rated in poor or very poor condition, and about half so rated in Oklahoma. This is well above what is considered average and ranks as a record (based on 1995-2010 data) for this time of year. About three-fourths of the wheat crop was rated in poor to very poor condition in Oklahoma (77 percent), Texas (74 percent), and New Mexico (70 percent), and just under half so rated in Colorado (46 percent) and Kansas (45 percent). The wheat crop completely failed in parts of west Texas and significant agricultural losses were incurred in western Oklahoma. In Texas, 75 percent of oats and 41 percent of corn were rated in poor to very poor condition.
The spring drought of 2011 resembled the historical droughts of the 1930s and 1950s across the southern United States. It was the driest April, February-April, January-April, and November-April in the 1895-2011 record for several climate divisions in New Mexico and Texas. The spatial pattern of the current drought in the South is similar, as measured by the PHDI, to the spatial pattern of the early 1950s drought in some respects, and the intensity (short-term dryness) of the current drought is locally as severe, or more severe, than the 1950s drought. However, in terms of duration, the 1950s drought lasted much longer in Texas [climate division 4 (East Texas) and climate division 5 (Trans Pecos)].
For more information on drought conditions see the March and April State of the Climate Drought Report.
In a direct relationship to the drought conditions across the Southern Plains, wildfires ravaged many parts of Texas and New Mexico during the January-April period. April 2011 was the most active April in terms of wildfires this century (since 2000), when 1.79 million acres (724,000 hectares) burned across the country, with most of the activity occurring across Texas. Between January 1st and April 30th, 2.2 million acres (890,000 hectares) burned across Texas, a year-to-date record according to the Texas State Forest Service. In addition to the extremely dry conditions, very warm temperatures dominated the Southern Plains during April, creating very low relative humidity. Several Texas cities had a top five driest and warmest April on record, including Austin and San Antonio. The warm temperatures and lack of moisture dried the available wildfire fuels.
The dry spell across Texas and New Mexico began during October 2010, with several months prior to October bringing above-normal precipitation to the region. Summer and spring of 2010 were particularly wet, creating ideal growing conditions across the two states. This led to an abundance of shrub and grass growth. After several months of below-normal precipitation during the winter and spring, these small plants dried out, making the ideal fuel for rapid wildfire development and growth. In April 2011, many factors came together to create the perfect weather conditions for wildfire development: the abundance of dried undergrowth, very warm temperatures, two months of little to no precipitation, and strong winds. According to reanalysis, low-level winds across the Southern Plains were 2.2 mph - 4.4 mph (1-2 m/s) stronger than 1971-2000 mean. Analysis of the U-component (east-west) of the wind shows that westerly winds across western Texas and eastern New Mexico were 4.4 mph - 6.7 mph (2-3 m/s) stronger than average near the surface. This indicates an intrusion of dry continental air over the region. The persistent strong winds were associated with the same upper level low pressure systems that brought the precipitation and storms to the Ohio Valley and Southeast. On the west side of these troughs, strong westerly winds set up behind the cold/dry fronts associated with the low pressure systems. The winds also actted to fan the flames, making them much more difficult to control by firefighters.
Several of the wildfires across Texas and New Mexico burned out of control for weeks and destroyed hundreds of thousands of acres. Most of the fires were ignited by lightning strikes, although some were human caused, both intentionally and unintentionally. Several major population centers were also directly impacted across Texas including Ft. Worth, Austin, and San Angelo. Through the end of April, for the year-to-date period, 1,134 structures, including 244 homes, were destroyed by fires across Texas. In San Angelo, the Wildcat fire forced the evacuation of hundreds of people due to fears of the fires overtaking entire neighborhoods. Several of the individual fires exceeded 100,000 acres (40,500 hectares) in size. The Rock House fire, which burned near Fort Davis, Texas burned nearly 315,000 acres (127,475 hectares) of land and destroyed 41 homes and two businesses. The Rock House Fire was the largest observed in Texas for the year. Governor Rick Perry declared a state of emergency for several counties, and asked for federal funds to help the firefighting efforts, which were estimated at two million dollars a day at the worst point of the wildfire outbreak.
According to the Texas AgriLife Extension Service, it is estimated that between November 2010 through May 2011, Texas ranchers lost 1.2 billion U.S. dollars because pastures have not greened across the state. The Texas wheat crop this year has been valued at 274 million U.S. dollars, which is less than half of the five-year average. In addition to the pasture land loss, livestock losses will also top one billion U.S. dollars due to lack of water and feed for cattle. Impacts from the 2006 drought exceeded 4.1 billion U.S. dollars across Texas and over 6 billion U.S. dollars nationwide. While the current drought impacts are not expected to exceed the impacts of the 2006 drought, if the poor crop conditions continue through summer 2011, the total economic loss will grow. The impacts of the wildfires across the Southern Plains were also large.
Large-scale climate and synoptic drivers played a role in the extreme weather events during April 2011, including the presence of La Niña, a persistent upper atmosphere storm track, and near historical sea surface temperatures across the Gulf of Mexico. Under a La Niña regime, an upper level ridge typically sets up across the southwestern U.S. and storms travel along the northern edge of the ridge and southward along the eastern side, bringing above-normal precipitation to the Canadian Border States and the Ohio Valley, but often blocks storms from entering the Southern Plains. This was the case during the 2010-2011 winter and into the spring, causing above-normal snowfall and snowpack across the Upper Midwest and parts of the Ohio River Valley. Once spring emerged across the region, the warm temperatures rapidly melted the snowpack, and combined with the continued above-average precipitation to cause rivers to swell. The limited storm activity across the Southern Plains and the Gulf Coast caused below-average precipitation during winter and spring across the region, and is consistent with expectations during La Niña. The nearly stationary ridge across the southwestern U.S. brought extremely dry and windy conditions to the Southern Plains during April. The windy conditions were reinforced by the active storm track to the north. When these storms intensified, wind speeds increased across New Mexico and Texas, causing rapid wildfire growth.
During spring, the seasonal re-emergence of warmer temperatures started across the southern regions of the U.S. and moved northward. During April, the boundary between the cooler air to the north and the warmer air to the south provided energy and dynamic forcing for storms to strengthen as they moved through the country. Ahead of these storm systems, warm southerly flow brought much-above-average temperatures and moisture from the Gulf of Mexico, where sea surface temperatures were about 1.0 °C (1.8 °F) above average. The above-average sea surface temperatures in the Gulf of Mexico contributed to above-average water vapor content in the atmosphere, increasing the amount of energy available for severe weather outbreaks. North of the temperature boundary, along the Ohio Valley, record precipitation fell, and to the southwest much-below-normal precipitation was observed. For the month of April, record statewide precipitation amounts fell in Indiana, Illinois, Kentucky, Ohio, Pennsylvania, and West Virginia, while much-below-normal precipitation was observed across Texas./p>
The extreme weather and climate events of April 2011 were far reaching. There was significant loss of life and economic impacts across the country, most of which will not be fully realized for months. Preliminary estimates place the total damage of property and economic impacts at over 20 billion U.S. dollars for all weather-related disasters during spring. The individual extreme events - tornado outbreaks, flooding, and drought/wildfires - have all been compared to the worst such events in U.S. history. In each of the previous ‘worst cases in history’, they occurred during different years, while several of these historical records were broken during the month of April 2011.
| Date(s) | Event | Estimated Damages |
|---|---|---|
| April 3rd--5th | Severe Weather Outbreak | 2 billion U.S. dollars |
| April 8th--11th | Severe Weather Outbreak | 2.25 billion U.S. dollars |
| April 25th-28th | Southeast Tornado Outbreak | 3.-6 billion U.S. dollars |
| Spring | Mississippi River Flooding | 9 billion U.S. dollars |
| Spring | Texas Drought | 1.2 billion U.S. dollars |
| May 22nd | Joplin, Missouri Tornado | 1-3 billion U.S. dollars |
Post Options
Thanks(0)
Quote Reply
Posted: June 14 2011 at 11:11pmWASHINGTON (AFP) - For years, scientists have been predicting the Sun would by around 2012 move into solar maximum, a period of intense flares and sunspot activity, but lately a curious calm has suggested quite the opposite.
According to three studies released in the United States on Tuesday, experts believe the familiar sunspot cycle may be shutting down and heading toward a pattern of inactivity unseen since the 17th century.
The signs include a missing jet stream, fading spots, and slower activity near the poles, said experts from the National Solar Observatory and Air Force Research Laboratory.
"This is highly unusual and unexpected," said Frank Hill, associate director of the NSO's Solar Synoptic Network, as the findings of the three studies were presented at the annual meeting of the American Astronomical Society's Solar Physics Division in Las Cruces, New Mexico.
"But the fact that three completely different views of the Sun point in the same direction is a powerful indicator that the sunspot cycle may be going into hibernation."
Solar activity tends to rise and fall every 11 years or so. The solar maximum and solar minimum each mark about half the interval of the magnetic pole reversal on the Sun, which happens every 22 years.
Hill said the current cycle, number 24, "may be the last normal one for some time and the next one, cycle 25, may not happen for some time.
"This is important because the solar cycle causes space weather which affects modern technology and may contribute to climate change," he told reporters.
Experts are now probing whether this period of inactivity could be a second Maunder Minimum, which was a 70-year period when hardly any sunspots were observed between 1645-1715, a period known as the "Little Ice Age."
"If we are right, this could be the last solar maximum we'll see for a few decades. That would affect everything from space exploration to Earth's climate," said Hill.
Solar flares and eruptions can send highly charged particles hurtling toward Earth and interfere with satellite communications, GPS systems and even airline controls.
Geomagnetic forces have been known to occasionally garble the world's modern gadgetry, and warnings were issued as recently as last week when a moderate solar flare sent a coronal mass ejection in the Earth's direction.
The temperature change associated with any reduction in sunspot activity would likely be minimal and may not be enough to offset the impact of greenhouse gases on global warming, according to scientists who have published recent papers on the topic.
"Recent solar 11-year cycles are associated empirically with changes in global surface temperature of 0.1 Celsius," said Judith Lean, a solar physicist with the US Naval Research Laboratory.
If the cycle were to stop or slow down, the small fluctuation in temperature would do the same, eliminating the slightly cooler effect of a solar minimum compared to the warmer solar maximum. The phenomenon was witnessed during the descending phase of the last solar cycle.
This "cancelled part of the greenhouse gas warming of the period 2000-2008, causing the net global surface temperature to remain approximately flat -- and leading to the big debate of why the Earth hadn't (been) warming in the past decade," Lean, who was not involved in the three studies presented, said in an email to AFP.
A study in the March 2010 issue of Geophysical Research Letters explored what effect an extended solar minimum might have, and found no more than a 0.3 Celsius dip by 2100 compared to normal solar fluctuations.
"A new Maunder-type solar activity minimum cannot offset the global warming caused by human greenhouse gas emissions," wrote authors Georg Feulner and Stefan Rahmstorf, noting that forecasts by the Intergovernmental Panel on Climate Change have found a range of 3.7 Celsius to 4.5 Celsius rise by this century's end compared to the latter half of the 20th century.
"Moreover, any offset of global warming due to a grand minimum of solar activity would be merely a temporary effect, since the distinct solar minima during the last millennium typically lasted for only several decades or a century at most."
 Post Options
Thanks(0)
Quote Reply
Posted: June 15 2011 at 10:04pm
Post Options
Thanks(0)
Quote Reply
Posted: June 16 2011 at 2:42pm
Post Options
Thanks(0)
Quote Reply
Posted: June 15 2011 at 10:04pm
Post Options
Thanks(0)
Quote Reply
Posted: June 16 2011 at 2:42pmFlumom
Interesting, the Earth is closer theory-thus hotter. Basic thermal principal, put hand closer to fire it gets hotter pull it away it gets cooler. I know we have been measuring the suns energy levels including thermal on earth for quite a few decades now so that should be easy to prove or disprove. Do you have anything on this? It would definetly relate to this thread (Temerature puzzle). Ill have to do some digging myself, a lot of the .gov's have opened up there datasets in the last couple of years its just figuring out how to acces and what programs are need to desifer them.
Post Options
Thanks(0)
Quote Reply
Posted: June 20 2011 at 9:14amJune 16, 2011
The globe experienced the 10th warmest May since record keeping began in 1880, as the climate phenomenon La Niña ended its 2011 cycle. The Arctic sea ice extent was the third smallest extent for May on record.
The monthly analysis from NOAA’s National Climatic Data Center is part of the suite of climate services NOAA provides government, business and community leaders so they can make informed decisions.
Global temperature highlights: May
Global temperature highlights: March – May
Global temperature highlights: Year-to-date
Polar sea ice and precipitation highlights
http://www.noaanews.noaa.gov/stories2011/20110615_globalstats.html
Post Options
Thanks(0)
Quote Reply
Posted: June 24 2011 at 12:30pm
Post Options
Thanks(0)
Quote Reply
Posted: June 30 2011 at 10:26amJune 29, 2011
Download here.
Statewide changes in annual "normal temperatures" (1981 - 2010 compared to 1971 - 2000). (Credit: NOAA)
According to the 1981-2010 normals to be released by NOAA�s National Climatic Data Center (NCDC) on July 1, temperatures across the United States were on average, approximately 0.5 degree F warmer than the 1971-2000 time period.
Normals serve as a 30 year baseline average of important climate variables that are used to understand average climate conditions at any location and serve as a consistent point of reference. The new normals update the 30-year averages of climatological variables, including average temperature and precipitation for more than 7,500 locations across the United States. This once-a-decade update will replace the current 1971-2000 normals.
In the continental United States, every state's annual maximum and minimum temperature increased on average. "The climate of the 2000s is about 1.5 degree F warmer than the 1970s, so we would expect the updated 30-year normals to be warmer," said Thomas R. Karl, L.H.D., NCDC director.
Using standards established by the World Meteorological Organization, the 30-year normals are used to compare current climate conditions with recent history. Local weathercasters traditionally use normals for comparisons with the day's weather conditions.
In addition to their application in the weather sector, normals are used extensively by electric and gas companies for short- and long-term energy use projections. NOAA's normals are also used by some states as the standard benchmark by which they determine the statewide rate that utilities are allowed to charge their customers.
The agricultural sector also heavily depends on normals. Farmers rely on normals to help make decisions on both crop selection and planting times. Agribusinesses use normals to monitor "departures from normal conditions" throughout the growing season and to assess past and current crop yields.
NCDC made many improvements and additions to the scientific methodology used to calculate the 1981-2010 normals. They include improved scientific quality control and statistical techniques. Comparisons to previous normals take these new techniques into account. The 1981-2010 normals provide a more comprehensive suite of precipitation and snowfall statistics. In addition, NCDC is providing hourly normals for more than 250 stations at the request of users, such as the energy industry.
Some of the key climate normals include: monthly and daily maximum temperature; monthly and daily minimum temperature; daily and monthly precipitation and snowfall statistics; and daily and monthly heating and cooling degree days. The 1981-2010 climate normals is one of the suite of climate services NOAA provides government, business and community leaders so they can make informed decisions. NOAA and its predecessor agencies have been providing updated 30-year normals once every decade since the 1921-1950 normals were released in 1956.
Post Options
Thanks(0)
Quote Reply
Posted: July 27 2011 at 8:02amJuly 21, 2011

Light from a lidar instrument forms a beam in the sky over Boulder, Colo.. NOAA researchers and colleagues used lidar data to better understand recent changes in the amounts of tiny particles high in Earth's atmosphere.
Download here. (Credit: CIRES/NOAA)
A recent increase in the abundance of particles high in the atmosphere has offset about a third of the current climate warming influence of carbon dioxide (CO2) change during the past decade, according to a new study led by NOAA and published today in the online edition of Science.
In the stratosphere, miles above Earth’s surface, small, airborne particles reflect sunlight back into space, which leads to a cooling influence at the ground. These particles are also called “aerosols," and the new paper explores their recent climate effects -- the reasons behind their increase remain the subject of ongoing research.
“Since the year 2000, stratospheric aerosols have caused a slower rate of climate warming than we would have seen without them,” says John Daniel, a physicist at the NOAA Earth System Research Laboratory (ESRL) in Boulder, Colo. and an author of the new study.
The new study focused on the most recent decade, when the amount of aerosol in the stratosphere has been in something of a “background” state, lacking sharp upward spikes from very large volcanic eruptions. The authors analyzed measurements from several independent sources – satellites and several types of ground instruments – and found a definitive increase in stratospheric aerosol since 2000.
“Stratospheric aerosol increased surprisingly rapidly in that time, almost doubling during the decade,” Daniel said. “The increase in aerosols since 2000 implies a cooling effect of about 0.1 watts per square meter – enough to offset some of the 0.28 watts per square meter warmingeffect from the carbon dioxide increase during that same period.”

Sources of aerosols reach the stratosphere from above and below, as shown in the graph. Sulfur dioxide (SO2), carbonyl sulfide (OCS), and dimethyl sulfide(DMS) are the dominant surface emissions which contribute to aerosol formation.
Download here. (Credit: NOAA)
The reasons for the 10-year increase in stratospheric aerosols are not fully understood and are the subject of ongoing research, says coauthor Ryan Neely, with the University of Colorado and the Cooperative Institute for Research in Environmental Sciences (CIRES). Likely suspects are natural sources – smaller volcanic eruptions – and/or human activities, which could have emitted the sulfur-containing gases, such as sulfur dioxide, that react in the atmosphere to form reflective aerosol particles.
Daniel and colleagues with NOAA, CIRES, the University of Colorado, NASA, and the University of Paris used a climate model to explore how changes in the stratosphere’s aerosol content could affect global climate change – both in the last decade, and projected into the future. The team concluded that models miss an important cooling factor if they don’t account for the influence of stratospheric aerosol, or don’t include recent changes in stratospheric aerosol levels.
Moreover, future global temperatures will depend on stratospheric aerosol. The warming from greenhouse gases and aerosols calculated for the coming decade can vary by almost a factor of two — depending on whether aerosols continue to increase at the same rate as over the past decade, or if instead they decrease to very low levels, such as those experienced in 1960.
If stratospheric aerosol levels continue to increase, temperatures will not rise as quickly as they would otherwise, said Ellsworth Dutton, also with NOAA ESRL and a co-author on the paper. Conversely, if stratospheric aerosol levels decrease, temperatures would increase faster. Dutton and his colleagues use the term “persistently variable” to describe how the background levels of aerosol in Earth’s stratosphere can change from one decade to the next, even in the absence of major volcanic activity.

Lidar instruments - pointing up from the ground or down from satellites - use reflected light to measure the amounts of particles and their locations, which can influence climate.
Download here. (Credit: CIRES/NOAA)
Ultimately, by incorporating the ups and downs of stratospheric aerosols, climate models will be able to give not only better estimates of future climate change, but also better explanations of past climate changes.
“The ‘background’ stratospheric aerosols are more of a player than we thought,” said Daniel. “The last decade has shown us that it doesn’t take an extremely large volcanic eruption for these aerosols to be important to climate.”
Authors of the paper are: Susan Solomon, University of Colorado; John Daniel, Chemical Sciences Division of NOAA’s Earth System Research Laboratory; Ryan Neely, CIRES-University of Colorado and NOAA-ESRL; J.P. Vernier, NASA-Langley Research Center and University of Paris; Ellsworth Dutton, Global Monitoring Division of NOAA-ESRL; and Larry Thomason, NASA-Langley.
Post Options
Thanks(0)
Quote Reply
Posted: July 30 2011 at 12:24pm
The globe experienced the seventh warmest June since record keeping began in 1880. The Arctic sea ice extent was the second smallest extent for June on record.
The monthly analysis from NOAA's National Climatic Data Center is part of the suite of climate services NOAA provides government, business and community leaders so they can make informed decisions.
Global Temperature Highlights: June
Global Temperature Highlights: Year to date
Polar Sea Ice and Precipitation Highlights
http://www.noaanews.noaa.gov/stories2011/20110714_globalstats.html
Post Options
Thanks(0)
Quote Reply
Posted: August 06 2011 at 7:10pmAugust 3, 2011

The direct warming influence of all long-lived greenhouse gases in the atmosphere today attributable to human activities. CO2's warming influence of 1.7 watts/m2 is equivalent to the heat from nearly 9 trillion 100-watt incandescent light bulbs placed across Earth's surface. The combined influence of the non-CO2 greenhouse gases is equivalent to the heat from about 5 trillion bulbs. The category '"ther" includes a few very long-lived chemicals that can exert a climate influence for millennia. (Credit: NOAA)
Carbon dioxide remains the undisputed king of recent climate change, but other greenhouse gases measurably contribute to the problem. A new study, conducted by NOAA scientists and published online today in Nature, shows that cutting emissions of those other gases could slow changes in climate that are expected in the future.
Discussions with colleagues around the time of the 2009 United Nations- climate conference in Copenhagen inspired three NOAA scientists - Stephen Montzka, Ed Dlugokencky and James Butler of NOAA's Earth System Research Laboratory in Boulder, Colo. - to review the sources of non-carbon dioxide (CO2) greenhouse gases and explore the potential climate benefits of cutting their emissions.
Like CO2, other greenhouse gases trap heat in Earth's atmosphere. Some of these chemicals have shorter lifetimes than CO2 in the atmosphere. Therefore cutting emissions would quickly reduce their direct radiative forcing - a measure of warming influence.
"We know that recent climate change is primarily driven by carbon dioxide emitted during fossil-fuel combustion, and we know that this problem is going to be with us a long-time because carbon dioxide is so persistent in the atmosphere," Montzka said. "But lowering emissions of greenhouse gases other than carbon dioxide could lead to some rapid changes for the better."

The direct radiative forcing (warming effect) of greenhouse gases under various scenarios. a) Red: constant 2008 emissions of both CO2 and non-CO2 greenhouse gases. b) An 80% cut in non-CO2 emissions. c) An 80% cut in CO2 emissions. d) An 80% cut in all greenhouse gas emissions. In all scenarios, emissions cuts are phased in between 2009 and 2050. (Credit: NOAA)
Scientists know that stabilizing the warming effect of CO2 in the atmosphere would require a decrease of about 80 percent in human-caused CO2 emissions - in part because some of the carbon dioxide emitted today will remain in the atmosphere for thousands of years. In contrast, cutting all long-lived non-CO2 greenhouse gas emissions by 80 percent could diminish their climate warming effect substantially within a couple of decades. Cutting both CO2 and non-CO2 greenhouse gas emissions to this extent could result in a decrease in the total warming effect from these greenhouse gases this century, the new paper shows.
For the new analysis, the researchers considered methane; nitrous oxide; a group of chemicals regulated by an international treaty to protect Earth's ozone layer; and a few other extremely long-lived greenhouse gases currently present at very low concentrations.
The new review paper describes the major human activities responsible for these emissions, and notes that steep cuts (such as 80 percent) would be difficult. Without substantial changes to human behavior, emissions of the non-CO2 greenhouse gases are expected to continue to increase.
The climate-related benefits of reductions in non-CO2 greenhouse gases have limits, Montzka and his colleagues showed. Even if all human-related, non-CO2 greenhouse gas emissions could be eliminated today, it would not be enough to stabilize the warming influence from all greenhouse gases over the next 40 years - unless CO2 emissions were also cut significantly.
The scientists also noted in the paper the complicated connections between climate and greenhouse gases, some of which are not yet fully understood. The non-CO2 gases studied have natural sources as well as human emissions, and climate change could amplify or dampen some of those natural processes, Dlugokencky said. Increasingly warm and dry conditions in the Arctic, for example, could thaw permafrost and increase the frequency of wildfires, both of which would send more methane and carbon dioxide into the atmosphere.
"The long-term necessity of cutting carbon dioxide emissions shouldn't diminish the effectiveness of short-term action. This paper shows there are other opportunities to influence the trajectory of climate change," Butler said. "Managing emissions of non-carbon dioxide gases is clearly an opportunity to make additional contributions."
Post Options
Thanks(0)
Quote Reply
Posted: August 06 2011 at 7:13pm
| Heat Defines the Country in July | |
| How hot was the month of July in 2011? So hot that just by
plotting the location of each daily heat record that was broken, a nearly
complete image of the contiguous United States is visible. Almost 9,000 daily
records were broken or tied last month, including 2,755 highest maximum
temperatures and 6,171 highest minimum temperatures (i.e., nighttime records).
It should be noted that the tally of records collected so far is not complete –
more are expected to come in as station data from across the U.S. is mailed to
the National Climatic Data Center. The statistics reported here only include
weather stations with real-time electronic reporting, which accounts for about
two-thirds of the locations. Final numbers should be available later in August.
This image plots how many times a heat record was broken or tied in a given location. Some cities reached daily high temperatures 19 out of the 31 days in the month. The largest concentration of these records occur in the southern Plains, Midwest, and Northeast U.S., which were gripped by a series of heat waves pushing heat indices well into the 100’s (Fahrenheit) for many days at a time. Temperature records are based on historical data from NCDC’s Cooperative Summary of the Day data set and the preliminary reports from the Cooperative Observers and National Weather Service stations around the country. All stations have at least 30 years of data upon which these records are based. |
Post Options
Thanks(0)
Quote Reply
Posted: August 15 2011 at 6:30pmAugust 15, 2011
The globe experienced its seventh warmest July since record keeping began in 1880. July's Arctic sea ice extent was the smallest on record for that month since records began in 1979.
The monthly analysis from NOAA's National Climatic Data Center is part of the suite of climate services NOAA provides government, business and community leaders so they can make informed decisions.
Global Temperature Highlights: July
Global Temperature Highlights: Year to date
Polar Sea Ice and Precipitation Highlights
http://www.noaanews.noaa.gov/stories2011/20110815_globalstats.html
Post Options
Thanks(0)
Quote Reply
Posted: September 02 2011 at 2:21pm
In August 2010, part of the Petermann Glasier about four times te size of Manhattan island broke off prompting a hearing in Congress.
Researcher Alun Hubbard, of the Centre for Glaciology at Aberystwyth University, U.K., told msnbc.com by phone that another section, about twice the size of Manhattan, appeared close to breaking off.
In 2009, scientists installed GPS masts on the glacier to track its movement.

But when they returned in July this year, they found the ice had been melting so quickly — at an unexpected 16-and-a-half feet in two years — that some of the masts stuck into the glacier were no longer in position.
Hubbard, who has been working with Jason Box, of Ohio State University, and others, said in a statement issued by the Byrd Polar Research Center that scientists were still trying to work out how fast the glacier was moving and the effect on the ice sheet feeding the glacier.
'Really weird'
But he said he was taken aback by the difference between 2009 and 2011 when he visited the glacier in late July.
Post Options
Thanks(0)
Quote Reply
Posted: September 09 2011 at 12:38pmAwsome High Res Pic Of Saturn (Cassini Space Craft)
 Post Options
Thanks(0)
Quote Reply
Posted: September 15 2011 at 1:26pm
Post Options
Thanks(0)
Quote Reply
Posted: September 15 2011 at 1:26pmSeptember 15, 2011

This monthly analysis from NOAA's National Climatic Data Center is part of the suite of climate services NOAA provides government, business and community leaders so they can make informed decisions.
Global Temperature Highlights: August
Global Temperature Highlights: June -- August
Global Temperature Highlights: Year to Date
http://www.noaanews.noaa.gov/stories2011/20110915_globalstats.html
Post Options
Thanks(0)
Quote Reply
Posted: September 17 2011 at 4:32pmSeptember 8, 2011
The blistering heat experienced by the nation during August, as well as the June through August months, marks the second warmest summer on record according to scientists at NOAA’s National Climatic Data Center (NCDC) in Asheville, N.C. The persistent heat, combined with below-average precipitation across the southern U.S. during August and the three summer months, continued a record-breaking drought across the region.
The average U.S. temperature in August was 75.7 degrees F, which is 3.0 degrees above the long-term (1901-2000) average, while the summertime temperature was 74.5 degrees F, which is 2.4 degrees above average. The warmest August on record for the contiguous United States was 75.8 degrees F in 1983, while its warmest summer on record at 74.6 degrees F occurred in 1936. Precipitation across the nation during August averaged 2.31 inches, 0.29 inches below the long-term average. The nationwide summer precipitation was 1.0 inch below average.
This monthly analysis, based on records dating back to 1895, is part of the suite of climate services NOAA provides.
U.S. climate highlights – August
Other U.S. climate highlights
http://www.noaanews.noaa.gov/stories2011/20110908_auguststats.html
|
Post Reply
|
Page <1 45678> |
 Tweet
Tweet
|
| Forum Jump | Forum Permissions You cannot post new topics in this forum You cannot reply to topics in this forum You cannot delete your posts in this forum You cannot edit your posts in this forum You cannot create polls in this forum You can vote in polls in this forum |


")


 Topic Options

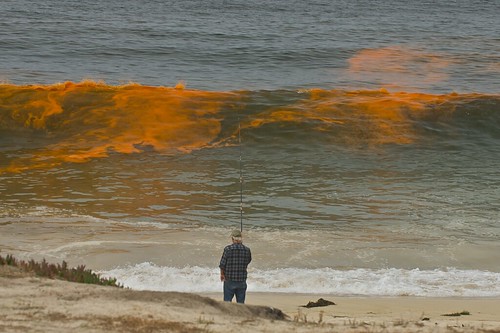
 Mary008 wrote:


 Global surface temperature Anomalies - July 2011. (Credit: NOAA)


