Global Climate Change (Temperature Puzzle)
Printed From: Avian Flu Talk
Category: Main Forums
Forum Name: General Discussion
Forum Description: (General discussion regarding the next pandemic)
URL: http://www.avianflutalk.com/forum_posts.asp?TID=26490
Printed Date: April 18 2024 at 2:28am
Topic: Global Climate Change (Temperature Puzzle)
Posted By: Mahshadin
Subject: Global Climate Change (Temperature Puzzle)
Date Posted: February 26 2010 at 5:47pm
|
NASA Weighs in with recent observations.
http://www.nasa.gov/multimedia/nasatv/on_demand_video.html?param=anon.nasa-global.edgesuite.net/anon.nasa-global/ccvideos/Temperature_Puzzle_portal.asx&_id=224966&_title=The%20Temperature%20Puzzle&_tnimage=429225main_temppuzzle-100.jp - http://www.nasa.gov/multimedia/nasatv/on_demand_video.html?param=http://anon.nasa-global.edgesuite.net/anon.nasa-global/ccvideos/Temperature_Puzzle_portal.asx&_id=224966&_title=The%20Temperature%20Puzzle&_tnimage=429225main_temppuzzle-100.jpg - |
Replies:
Posted By: Mahshadin
Date Posted: February 26 2010 at 6:46pm
|
More detail on Temp (NASA)
http://www.nasa.gov/multimedia/nasatv/on_demand_video.html?param=http://anon.nasa-global.edgesuite.net/anon.nasa-global/ccvideos/GSFC_20100121_GlobalTempAvg.asx&_id=221087&_title=Global%20Temperature%20Increase&_tnimage=418330main_2008temp100x75.jpg -
|
Posted By: Mahshadin
Date Posted: February 26 2010 at 7:01pm
|
Last of GOES Satalites goes up in 2010
NASA+++NOAA
GOES-P
http://www.nasa.gov/multimedia/nasatv/on_demand_video.html?param=http://anon.nasa-global.edgesuite.net/anon.nasa-global/ccvideos/GSFC_20100222_GOES-P.asx&_id=224822&_title=All%20About%20GOES&_tnimage=428808main_goespthumb-100.jpg - ------------- "In a time of universal deceit, telling the truth is a revolutionary act." G Orwell |
Posted By: Mary008
Date Posted: February 26 2010 at 11:27pm
| hi... I enjoyed the videos... our summers have been like a rain forest the past 5 yrs. |
Posted By: Turboguy
Date Posted: February 28 2010 at 9:02am
|
Pfft, we could use the heat up here. It's been ridiculously cold here all year. You bring Al "The Hypocrite" Gore here to Minnesota and we'll hang his arse for telling us it was going to get warmer when it's not. |
Posted By: Mahshadin
Date Posted: February 28 2010 at 9:36am
|
Another recent and important tool
in understanding some of the remaining questions (SUN-Solar System))
(Launch 02/11/2010).
 About The SDO MissionSDO: The Solar Dynamics Observatory is the first mission to be launched for NASA's Living With a Star (LWS) Program, a program designed to understand the causes of solar variability and its impacts on Earth. SDO is designed to help us understand the Sun's influence on Earth and Near-Earth space by studying the solar atmosphere on small scales of space and time and in many wavelengths simultaneously. SDO's goal is to understand, driving towards a predictive capability, the solar variations that influence life on Earth and humanity's technological systems by determining
SDO ScienceSDO will help us to understand the how and why of the Sun's magnetic changes. It will determine how the magnetic field is generated and structured, and how the stored magnetic energy is released into the heliosphere and geospace. SDO data and analysis will also help us develop the ability to predict the solar variations that influence life on Earth and humanity's technological systems. SDO will measure the properties of the Sun and solar activity. There are few types of measurements but many of them will be taken. For example, the surface velocity is measured by HMI. This data can be used for many different studies. One is the surface rotation rate, which must be removed to study the others. After subtracting the rotation, you have the oscillation and convective velocities. The latter look like billows of storm clouds covering the Sun. Hot gas moves outward at the center of the billows and downward at the edges, just like boiling water. By looking at these velocities you can see how sunspots affect the convection zone. By looking at a long sequence of data (more than 30 days), you see the oscillations of the Sun (like the picture). These patterns can be used to look into and through the Sun.
SDO InstrumentsSDO contains a suite of instruments that will provide observations leading to a more complete understanding of the solar dynamics that drive variability in the Earth's environment. This set of instruments will:
The Science Teams will receive the data from SDO. They will process, analyze, archive, and serve the data. http://sdo.gsfc.nasa.gov/assets/img/site/HMI.jpg">

http://sdo.gsfc.nasa.gov/assets/img/site/AIA.jpg">

http://sdo.gsfc.nasa.gov/assets/img/site/EVE.jpg">
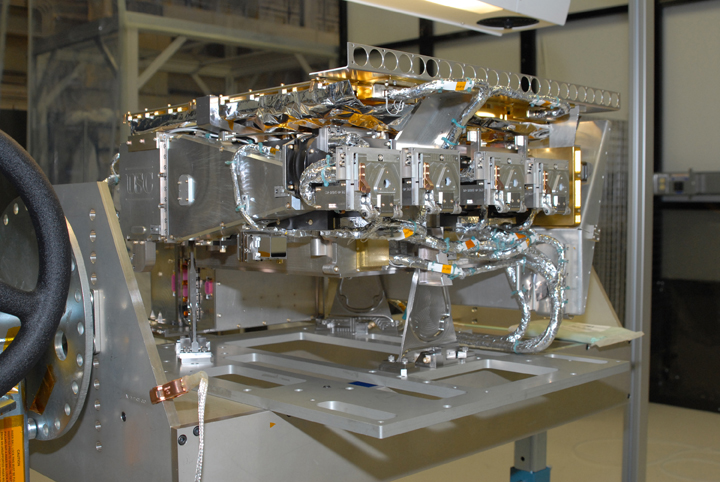
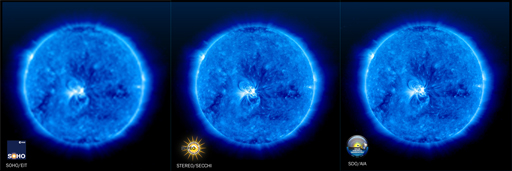
Image Resolution ComparisonThe following image illustrates the resolution capabilities of the SDO, STEREO, and SOHO spacecrafts. SDO's AIA instrument (right image) will have 1/2 greater image resolution than STEREO (middle image) and 3/4 greater imaging resolution than SOHO (left image). The image cadience also varies. SDO takes 1 image every .10 of a second. At best STEREO takes 1 image every 3 minutes and SOHO takes 1 image every 12 minutes. http://sdo.gsfc.nasa.gov/assets/img/site/resolution_comparison.jpg"> More information available
http://sdo.gsfc.nasa.gov/mission/about.php - http://sdo.gsfc.nasa.gov/mission/about.php
------------- "In a time of universal deceit, telling the truth is a revolutionary act." G Orwell |
Posted By: Mahshadin
Date Posted: March 02 2010 at 8:11pm
|
------------- "In a time of universal deceit, telling the truth is a revolutionary act." G Orwell |
Posted By: Mahshadin
Date Posted: March 03 2010 at 7:19am
|
Eyes ion the Earth
Very Neat 3d interactive animation of the 12 or so current satelites collecting data related to Global Climate Change.
http://climate.nasa.gov/ - http://climate.nasa.gov/Eyes/ - http://climate.nasa.gov/Eyes/Current Situaltional Website with 5 measurables posted.
http://climate.nasa.gov/ - http://climate.nasa.gov/
------------- "In a time of universal deceit, telling the truth is a revolutionary act." G Orwell |
Posted By: Mahshadin
Date Posted: March 06 2010 at 7:15am
|
3-2-1 and Liftoff of GOES-P! The Delta IV carrying GOES-P lifted off at 6:57 p.m. EST from Launch Complex 37B at Cape Canaveral Air Force Station in Florida. After reaching orbit, GOES-P will become GOES-15. The satellite will be used to monitor and predict weather, measure ocean temperatures, perform climate studies, and detect hazards with its emergency beacon support and Search and Rescue Transponder. GOES-P was built by Boeing for NASA and the National Oceanic and Atmospheric Administration, or NOAA.  Image above: A Delta IV launch vehicle lifts off carrying GOES-P into orbit. Image credit: NASA/Kenny Allen Image above: A Delta IV launch vehicle lifts off carrying GOES-P into orbit. Image credit: NASA/Kenny Allen http://www.nasa.gov/images/content/429913main__CC27656.jpg - › Larger Image Geostationary Operational Environmental Satellite-P, or GOES-P, is the latest in a series of meteorological satellites designed to watch for storm development and weather conditions on Earth. From its location in Earth orbit, GOES-P's state-of-the-art instrumentation will supply data used in weather monitoring, forecasting and warnings. It also will detect ocean and land temperatures, monitor space weather, relay communications and provide search-and-rescue support. http://www.nasa.gov/mission_pages/GOES-P/main/index.html - http://www.nasa.gov/mission_pages/GOES-P/main/index.html
_____________________________________________________________________
Night Video of Launch
http://www.nasa.gov/multimedia/podcasting/goesp_launch.html - http://www.nasa.gov/multimedia/podcasting/goesp_launch.html
------------- "In a time of universal deceit, telling the truth is a revolutionary act." G Orwell |
Posted By: Mary008
Date Posted: March 06 2010 at 12:51pm
|
....designed to watch for storm development and weather conditions on Earth. ............ Thanks Mahs... very interesting info...( still long on going green. ) ............ |
Posted By: Mahshadin
Date Posted: March 07 2010 at 7:46am
Nasa's Solar & Heliospheric Observatory (SOHO) captures a rare solar event._________________________________________________________________ |

Posted By: Mahshadin
Date Posted: March 07 2010 at 6:50pm
Hey Mary008, yes I have enjoyed many of the incredible earth based satellite loops & images provided by these satellites and the NOAA.
GOES satellite(s) are involved in more than just (On Earth) weather
|
 Mary008 wrote:
Posted By: Mahshadin
Date Posted: March 08 2010 at 11:05am
|
Whats going on with the planets oceans
Low Oxygen levels creating (Dead Zones), quickly becoming more acidic, and losing salinity.
Short Video on the Northwest (USA)
http://www.nsf.gov/news/special_reports/deadzones/index.jsp - http://www.nsf.gov/news/special_reports/deadzones/index.jsp
Interview with Oregon State University (Jack Barth)
http://www.nsf.gov/news/special_reports/deadzones/webcast.jsp - http://www.nsf.gov/news/special_reports/deadzones/webcast.jsp
_______________________________________________________________________
Growing low-oxygen zones in oceans worry scientists
By Les Blumenthal, McClatchy Newspapers Les Blumenthal, Mcclatchy Newspapers � Sun Mar 7, 12:01 pm ET
WASHINGTON � Lower levels of oxygen in the Earth's oceans, particularly off the United States' Pacific Northwest coast, could be another sign of fundamental changes linked to global climate change, scientists say. They warn that the oceans' complex undersea ecosystems and fragile food chains could be disrupted. In some spots off Washington state and Oregon , the almost complete absence of oxygen has left piles of Dungeness crab carcasses littering the ocean floor, killed off 25-year-old sea stars, crippled colonies of sea anemones and produced mats of potentially noxious bacteria that thrive in such conditions. Areas of hypoxia, or low oxygen, have long existed in the deep ocean. These areas � in the Pacific, Atlantic and Indian oceans � appear to be spreading, however, covering more square miles, creeping toward the surface and in some places, such as the Pacific Northwest , encroaching on the continental shelf within sight of the coastline. "The depletion of oxygen levels in all three oceans is striking," said Gregory Johnson , an oceanographer with the National Oceanic and Atmospheric Administration in Seattle . In some spots, such as off the Southern California coast, oxygen levels have dropped roughly 20 percent over the past 25 years. Elsewhere, scientists say, oxygen levels might have declined by one-third over 50 years. "The real surprise is how this has become the new norm," said Jack Barth , an oceanography professor at Oregon State University . "We are seeing it year after year." Barth and others say the changes are consistent with current climate-change models. Previous studies have found that the oceans are becoming more acidic as they absorb more carbon dioxide and other greenhouse gases. "If the Earth continues to warm, the expectation is we will have lower and lower oxygen levels," said Francis Chan , a marine researcher at Oregon State . Entire Story http://news.yahoo.com/s/mcclatchy/20100307/sc_mcclatchy/3444187 - http://news.yahoo.com/s/mcclatchy/20100307/sc_mcclatchy/3444187
------------- "In a time of universal deceit, telling the truth is a revolutionary act." G Orwell |
Posted By: Mahshadin
Date Posted: March 09 2010 at 10:34pm
TG
The weather has been wacky here as well, we have gotten more rain in first 2 months of this year than the entire previous year (2009).
the Desert is green (Literally), we dont see this very often. It is quite the sight, a brown to black environment converted into a blanket of green. I need to get out and take some pictures. ------------- "In a time of universal deceit, telling the truth is a revolutionary act." G Orwell |
Posted By: Mahshadin
Date Posted: March 13 2010 at 6:21am
http://grace.jpl.nasa.gov/news/index.cfm?FuseAction=ShowNews&NewsID=34 - http://grace.jpl.nasa.gov/news/index.cfm?FuseAction=ShowNews&NewsID=34
------------- "In a time of universal deceit, telling the truth is a revolutionary act." G Orwell |

Posted By: 4=laro
Date Posted: March 13 2010 at 7:20am
| Good Grief Charlie Brown, lets panic, give up Cap and Trade. |
Posted By: Turboguy
Date Posted: March 13 2010 at 9:58am
|
No no no, bring out cap and trade! Let's seal the deal and kick the Dems out of office for the foreseeable future. The Dems think they've taken a pounding over healthcare? Just wait for them to unveil the largest, economy destroying tax hike in world history! Nothing like $4 a gallon gasoline to get the people screaming for blood! |
Posted By: Mahshadin
Date Posted: March 14 2010 at 9:05am
|
TG & 4=Laro
Whats your answer then? Do Nothing
TG we have already had $4.00 gas and we will get there again and even more with or without cap and trade if we do not chaange our mindset on Oil.
I know how bout we give a tax break to people who buy this
Estimated at over 200 MPG, which sounds like fuzzy math but even if it ends up at a 100mpg is a significant improvement. Due out November 2010
http://upload.wikimedia.org/wikipedia/commons/0/0f/2011_Chevrolet_Volt_--_2010_DC.jpg">
 Instead of like Bush giving Tax Break for buying this
10 to 14 MPG
http://upload.wikimedia.org/wikipedia/commons/f/f8/Ab_car_07.jpg">
 Just a thought
------------- "In a time of universal deceit, telling the truth is a revolutionary act." G Orwell |
Posted By: mrmouse
Date Posted: March 14 2010 at 10:14am
|
I thought we need $7.00 a gallon gasoline to reduce CO2 emissions? Oh, wait a minute it's not about reducing CO2 emissions, it's about further taxation and repressions! Why do I say repressions, because I won't be able to afford the $10,000 airfare to fly my family to Kauai in the future.
http://blog.heritage.org/2010/03/03/7-a-gallon-gas-needed-to-meet-government’s-co2-cuts/ - http://blog.heritage.org/2010/03/03/7-a-gallon-gas-needed-to-meet-government’s-co2-cuts/ George Carlin - Saving the Planet! George uses some fowl language, so be warned if you are of the faint of heart! http://www.youtube.com/watch?v=eScDfYzMEEw - http://www.youtube.com/watch?v=eScDfYzMEEw |
Posted By: mrmouse
Date Posted: March 14 2010 at 10:24am
|
I don't know why the previous hyperlinks didn't work?
$7-A-Gallon Gas Needed to Meet Government's CO2 Cuts http://blog.heritage.org/2010/03/03/7-a-gallon-gas-needed-to-meet-government’s-co2-cuts/ George Carlin - Saving the Planet! George uses some fowl language, so be warned if you are of the faint of heart! http://www.youtube.com/watch?v=eScDfYzMEEw |
Posted By: Technologist
Date Posted: March 14 2010 at 3:12pm
mrmouse: I fixed one of your links but the other link has a weird character in it.
Gas hit $5 a Gallon where I live. I'm guilty! I bought a 2008 8,200 pound (empty) Twin Turbo Diesel Truck because of that $25K 179 deduction. With all write-offs I "saved" money by buying that truck. With my tax bracket its like, Hey you want a free truck and some extra cash? If the savings were for a 100-200 MPG vehicle I would jump on that instead. |
Posted By: Turboguy
Date Posted: March 14 2010 at 4:08pm
How about not laying the vast majority of the pain on the lowest wage earners? Isn't that what the Democratic party, and in particular the Liberal position happens to be? When gasoline hit $4 a gallon it didn't hurt the rich, it far disproportionally affected the Lower Middle class and the poor. The entire position that healthcare is necessary is to control costs on the poor, but then the Dems are toying with the idea of raising the costs of everything else 75% to 150% or more. I'm at a loss as to how that's a net gain... Right now it costs me right around $75 a month to heat my house, and I am a warm blooded person that leaves the thermostat at 63. If the cost of natural gas is raised as little as 50% my wintertime heating bill jumps well over $100. In this part of the country you absolutely must have heat just to live as life in -30f is extremely difficult. Then the price of electricity jumps 100%, and gasoline jumps 150% to let's say a conservative $4.65 a gallon, if you think people are struggling now, wait six months after Cap and Trade is enacted! You see, the problem with gasoline jumping 150% or even 100% is that the cost of everything must also jump as those trucks that haul the grub to the shelves just don't run on "Hope" and "Change." They run on Diesel, which will also jump dramatically. Truckers don't drive when they're not going to make any money by doing so because they had to spend $700 filling up. $5.75 a gallon for diesel is the zero point, the event horizon if you will, where truckers stop making money by hauling. Beyond this point they are actually going to start losing money hauling even the lighter goods.
Cap and Trade isn't just about oil, or gasoline that we put in our cars so we can get to and from work. It's about trying to fund a bloated boondoggle with another boondoggle and acting like they're helping anyone out in the process. Don't get me wrong, we are in for a major oil-tastrophe in our lifetimes and there simply isn't any real way out of it. Is jacking up the price of everything going to help anyone or anything in the end? Probably not. Regardless of what anyone wants to say, there isn't going to be a "Soft Landing." There's not going to be any super technology that's going to pop in at the last second and save our way of life. It's just not going to happen. I suppose if your position that by raising the price of gas you're going to get all those dirty poor people off the road is the goal, then that's exactly what you're going to get, along with extreme crime, further dichotomy of rich and poor, and extreme classism.
And I'd buy me one if the price isn't astronomically high and the car could fit my 6'1" 195 frame comfortably. I totally agree that we should be giving tax breaks for buying more economical vehicles as that will drive the price of gasoline for our cars down and I wouldn't have to spend all my hard earned cash burning it in my engine. That still doesn't solve the problem I touched on above with the truckers and the heat and whatnot though.
Yeah that was a stupid one wasn't it? So was bailing out the manufacturer of that pink beast that not many people wanted in the first place... |
Posted By: Mahshadin
Date Posted: March 17 2010 at 9:54am
|
[QUOTE=Technologist] Gas hit $5 a Gallon where I live. I'm guilty! I bought a 2008 8,200 pound (empty) Twin Turbo Diesel Truck because of that $25K 179 deduction. With all write-offs I "saved" money by buying that truck. With my tax bracket its like, Hey you want a free truck and some extra cash? If the savings were for a 100-200 MPG vehicle I would jump on that instead.[/QUOTE] ______________________________________________________________________
So would a lot of Americans, now that it looks as though our transportation costs will stay 35% higher and rising (Gas). I have a larger vehicle as well (2008 Tahoe), and also a more economical (2006 Prius). The Tahoe we have because we need the room when transporting family (Large Extended Family) and 4X4 excursions. The Prius I used to commute to and from work 48 miles round trip. That Vehicle was very good on gas (Depending on your lead foot). I got to the point where could average around 45-50 miles to the gallon with it. The some young kid whaled into the back of me going 55-60 while I was sitting at a red light (Toast). The amazing thing is the car was totaled but the battery was in perfect condition as was the back and front seating (I walked away). I bought it just before the gas thing went through the roof. When gas was in the mid 4 dollar range Toyota called me back wanting to buy the car back for 5 grand more than I paid (Guess I should have sold it) I have not replaced the car yet and am now driving the Tahoe and wow what a difference in (Money) (Gas). The Prius I would fill up once ever 2 to three weeks, and it was a small tank. The Tahoe, well I don’t have to tell you, I might as well just buy the frickn gas station, I am there so much, but it is still useful 4X4, and seating for 8, just not a good everyday commute car. It is a flex fuel vehicle so if I go to the Midwest or brazil I guess I could use that but in the desert here the closest gas station that carries it is 30 miles away. Times they are a changing. ------------- "In a time of universal deceit, telling the truth is a revolutionary act." G Orwell |
Posted By: Mahshadin
Date Posted: March 17 2010 at 10:54am
_______________________________________________________________________
We the People (Government) have very little to do with pricing of gas mrmouse. We have spent the past 30 years derugulating these idustries. When we give up our control it does not disappear it just shifts into other hands, in this case Corps who have but one mission
Profits
More Profits
Add a little greed
Excesive Profits
In this case Economy Crippling Profits
But hey everythings good right, especially if your at the top of that pyramid scheme. You even get the Government (The People) to fight the wars to secure your supply & Contracts.
WOW
What A Deal
Where do we all sign up ------------- "In a time of universal deceit, telling the truth is a revolutionary act." G Orwell |
Posted By: Dr.Who
Date Posted: March 17 2010 at 5:10pm
|
Anti corporate paranoia can be irrational sometimes. Corporations work against each other but they work hand in hand with congress. The one who holds the puppet strings is more likely to be congress than an imaginary coalition of corporations. Restore the proper role of congress to police people and corporations who do wrong and not to micromanage our lives and the actions of corporations, get congress out of bed with the lobbyists and we will all be better off. |
Posted By: Mahshadin
Date Posted: March 17 2010 at 6:21pm
_____________________________________________________________
Corporate Paranoi-izm (Where)? I havent heard any All I hear is .Gov Paranoi-izm (Over & Over & Over). Must be something to that whole repetition thing huh We just spent 30 years taking the handcuffs off thus crippling .gov (The People) from overseeing Corps in any significant way. Perhaps we should blame ouselves instead of others, we all got conned together. ------------- "In a time of universal deceit, telling the truth is a revolutionary act." G Orwell |
Posted By: sjf53
Date Posted: March 17 2010 at 10:25pm
|
http://www2.sunysuffolk.edu/mandias/lia/vikings_during_mwp.html - http://www2.sunysuffolk.edu/mandias/lia/vikings_during_mwp.html
http://www2.sunysuffolk.edu/mandias/lia/vikings_during_mwp.html - Vikings During the Medieval Warm Period - Influence of Dramatic Climate Shifts on European Civilizations: The Rise and Fall o.
During the years 800-1200, Iceland and Greenland were settled by the Vikings. These people, also known as the Norse, included Norwegians, Swedes, Danes, and Finns. Fig. 12 shows the various routes the Vikings took to these locations and others.
 Figure 12: Routes various Vikings traveled. (Source: McGovern and Perdikaris, 2000) Fig. 13 illustrates a knorr, the type of ship Vikings used to travel these long distances.
 Figure 13: A Viking knorr. (Source: McGovern and Perdikaris, 2000) The warm climate during the MWP allowed this great migration to flourish. Drift ice posed the greatest hazard to sailors but reports of drift ice in old records do not appear until the thirteenth century (Bryson, 1977.) The Norse peoples traveled to Iceland for a variety of reasons including a search for more land and resources to satisfy a growing population and to escape raiders and harsh rulers. One force behind the movement to Iceland in the ninth century was the ruthlessness of Harald Fairhair, a Norwegian King (Bryson, 1977.)
Vikings travelling to Iceland from Norway during the MWP were probably encouraged by the sight of pastures with sedges and grasses and dwarf woodlands of birch and willow (Fig. 14) resembling those at home.
 Figure 14: Sedges, grasses, and dwarf woodlands of birch and willow. (Source: McGovern and Perdikaris, 2000) Animal bones and other materials collected from archaeological sites reveal Icelandic Vikings had large farmsteads with dairy cattle (a source of meat), pigs, and sheep and goats (for wool, hair, milk, and meat.) Farmsteads also had ample pastures and fields of barley used for the making of beer and these farms were located near bird cliffs (providing meat, eggs, and eiderdown) and inshore fishing grounds. Fishing was primarily done with hand lines or from small boats that did not venture across the horizon (McGovern and Perdikaris, 2000.)
In 960, Thorvald Asvaldsson of Jaederen in Norway killed a man. He was forced to leave the country so he moved to northern Iceland. He had a ten year old son named Eric, later to be called Eric Röde, or Eric the Red. Eric too had a violent streak and in 982 he killed two men. Eric the Red was banished from Iceland for three years so he sailed west to find a land that Icelanders had discovered years before but knew little about. Eric searched the coast of this land and found the most hospitable area, a deep fiord on the southwestern coast. Warmer Atlantic currents met the island there and conditions were not much different than those in Iceland (trees and grasses.) He called this new land "Greenland" because he "believed more people would go thither if the country had a beautiful name," according to one of the Icelandic chronicles (Hermann, 1954) although Greenland, as a whole, could not be considered "green." Additionally, the land was not very good for farming. Nevertheless, Eric was able to draw thousands to the three areas shown in Fig. 15.
 Figure 15: Ancient Norse settlements. (Source: Bryson, 1977) The Greenland Vikings lived mostly on dairy produce and meat, primarily from cows. The vegetable diet of Greenlanders included berries, edible grasses, and seaweed, but these were inadequate even during the best harvests. During the MWP, Greenland's climate was so cold that cattle breeding and dairy farming could only be carried on in the sheltered fiords. The growing season in Greenland even then was very short. Frost typically occurred in August and the fiords froze in October. Before the year 1300, ships regularly sailed from Norway and other European countries to Greenland bringing with them timber, iron, corn, salt, and other needed items. Trade was by barter. Greenlanders offered butter, cheese, wool, and their frieze cloths, which were greatly sough after in Europe, as well as white and blue fox furs, polar bear skins, walrus and narwhal tusks, and walrus skins. In fact, two Greenland items in particular were prized by Europeans: white bears and the white falcon. These items were given as royal gifts. For instance, the King of Norway-Denmark sent a number of Greenland falcons as a gift to the King of Portugal, and received in return the gift of a cargo of wine (Stefansson, 1966.) Because of the shortage of adequate vegetables and cereal grains, and a shortage of timber to make ships, the trade link to Iceland and Europe was vital (Hermann, 1954.)
|
Posted By: Mahshadin
Date Posted: March 18 2010 at 9:44am
|
This years Sun-Earth day focuses on Magnetism (Our Solar System)
________________________________________________________
NASA
SUN-EARTH DAY (March 20, 2010)
http://sunearthday.nasa.gov/2010/index.php - http://sunearthday.nasa.gov/2010/index.php
______________________________________________________________________
Good look at the sun (near real time) and other various measurements (SOHO Mission)
______________________________________________________________________
NASA's New (Space Weather Media Viewer) (Near Real-Time)
http://sunearth.gsfc.nasa.gov/spaceweather/FlexApp/bin-debug/index.html - http://sunearth.gsfc.nasa.gov/spaceweather/FlexApp/bin-debug/index.html #
------------- "In a time of universal deceit, telling the truth is a revolutionary act." G Orwell |
Posted By: Mahshadin
Date Posted: March 18 2010 at 4:20pm
|
NASA IceBridge Mission Prepares for Study of Arctic Glaciers
03.18.10
 NASA's DC-8 sits on the runway at Dryden's Aircraft Operations Facility in Palmdale, Calif., prior to the Operation IceBridge test flight on March 17, 2010. Testing objectives for each instrument were successfully met during the 5.8-hour flight. Credit: NASA/Tom Tschida The IceBridge mission allows scientists to track changes in the extent and thickness of polar ice, which is important for understanding ice dynamics. IceBridge began in March 2009 as a means to fill the gap in polar observations between the loss of NASA's Ice, Cloud and land Elevation Satellite, or ICESat, and the launch of ICESat-2, planned for 2015. Annual missions fly over the Arctic in March and April and over Antarctica in October and November. "NASA's IceBridge mission is characterizing the changes occurring in the world's polar ice sheets," said Tom Wagner, cryosphere program manager at NASA Headquarters in Washington. "The mission's goal is to collect the most important data for improving predictive models of sea level rise and global climate change." Researchers plan to resurvey previous flight lines and former ground tracks of ICESat while adding new areas of interest. Scientists also will target some areas that have been undergoing mysterious changes. The major glaciers in southeast Greenland once thinned simultaneously, but some of those glaciers have been thinning at an accelerated rate -- as much as 40 feet per year -- while others have thickened. And glaciers in northwest Greenland, once a stable region, have mostly begun to thin.  NASA research pilots Dick Ewers (center) and Bill Brockett (right) of Dryden Flight Research Center, Edwards, Calif., and crew are briefed prior to an Operation IceBridge "shake down" test flight on March 17, 2010, from Dryden's Aircraft Operations Facility in Palmdale, Calif. Credit: NASA/Tom Tschida In preparation for approximately 200 science flight hours during the spring 2010 campaign, engineers have been outfitting NASA's DC-8 aircraft with an array of science instruments. On March 21-22, the aircraft will travel to Thule, Greenland, where researchers and crew will spend about five weeks making 10 to 12 science flights. The first priority is to survey Arctic sea ice, which reaches its maximum extent each year in March or early April. High- and low-altitude flights also will survey Greenland's ice sheet and outlet glaciers. In mid-April, the engineers will transfer the science instruments to the smaller, more maneuverable P-3B aircraft. The crew will spend May making another 10 to 12 science flights from Kangerlussuaq and Thule, Greenland. Both aircraft will carry the Airborne Topographic Mapper, or ATM -- a laser altimeter similar to those on ICESat. ATM measures changes in the surface elevation of the ice by reflecting lasers from the ground back to the aircraft and converting the readings into elevation maps. Another laser altimeter, the Land, Vegetation, and Ice Sensor, operates at higher altitudes and can survey larger areas quickly. The spring flights are led by project scientists Lora Koenig of NASA's Goddard Space Flight Center in Greenbelt, Md., and Michael Studinger of Goddard Earth Science and Technology Center at the University of Maryland. The mission also includes scientists, crew and technicians from Goddard, Wallops, NASA's Dryden Flight Research Center in Edwards, Calif., NASA's Ames Research Center in Moffett Field, Calif.; The Earth Institute at Columbia University in Palisades, N.Y.; the University of Kansas; and the University of Washington. 
NASA's Operation IceBridge mission will make science flights from Kangerlussuaq and Thule, Greenland, in spring 2010 to survey the area's ice sheet, outlet glaciers and sea ice. Credit: NASA The versatility of the planes will allow some new observations not currently possible from satellites. Radar instruments from the University of Kansas and a gravimeter from Columbia University will allow scientists to "see" snow, ice, and bedrock characteristics at depths below the surface. Such information will enhance our understanding of glacier and ice sheet processes and will help scientists predict a glacier's future behavior.
"NASA has a unique capability to look at these things from a bird's-eye perspective, not only from space but also from multiple long-range, high performance aircraft," said John Sonntag, a senior scientist with URS Corporation in Wallops Island, Va., and member of the IceBridge management team. "If not for IceBridge, the global science community and the public would miss out on a great deal of knowledge about Greenland and Antarctica." Kathryn Hansen
NASA's Earth Science News Team http://www.nasa.gov/topics/earth/features/icebridge-flights.html - http://www.nasa.gov/topics/earth/features/icebridge-flights.html
 ------------- "In a time of universal deceit, telling the truth is a revolutionary act." G Orwell |
Posted By: Turboguy
Date Posted: March 18 2010 at 6:01pm
COOL WEBSITE MAN!!! Imma favorite that one. Astronomy has always interested me like nothing else. In other news: My leg  |
Posted By: Mahshadin
Date Posted: March 18 2010 at 10:57pm
Whats up with the leg?
That looks like some serious workmanship!
------------- "In a time of universal deceit, telling the truth is a revolutionary act." G Orwell |
Posted By: Turboguy
Date Posted: March 19 2010 at 12:20am
|
Trimalleolar break of my ankle. I snapped my Fibula right where the gap in the screws is on the eight hole plate and the two longer screws is where I snapped off the side of my Tibia and then another chip. The doctors have me moving it around to regain the range of motion and whoo boy does it hurt when I move it around. |
Posted By: mrmouse
Date Posted: March 19 2010 at 8:39am
| I feel your pain Turboguy! I had my right knee joint crushed, tibial plateau fracture in April of 2000. I had a O.R.I.F. with nine screws and a four and half inch t-plate. Scare tissue was a huge issue for me because I was none weight bearing for six months, and stuck in a hinged brace. Time heals all wounds brother, and never give up the fight! |
Posted By: Turboguy
Date Posted: March 19 2010 at 10:15am
|
Six times in war, two before OIF/OEF, five after eight deployments to hotspots including Sudan, Rwanda, Colombia and Bosnia. Never got hurt. Wrestling around with my younger (Not necessarily little) brother and I break my leg. Mouse, it's interesting that your procedure was called the same thing as mine. ORIF. The after surgery pain was like nothing I've ever experienced before. It was absolutely incredible! I couldn't even form a coherent thought it was so intense. I thought getting shot in the leg hurt like a bitch, but in comparison, it was nothing. |
Posted By: Mahshadin
Date Posted: March 19 2010 at 11:33am
__________________________________________________________________
Ouch, I feel your pain just looking at that x-ray (Thats gotta hurt). My thoughts and prayers go with you in what looks to be a bit of a recovery time and therapy. On the positive side: You will probably be able to tell when the weather is changing before the weather man. _____________________________________________________________
NASA's New (Space Weather Media Viewer) (Near Real-Time) http://sunearth.gsfc.nasa.gov/spaceweather/FlexApp/bin-debug/index.html# - http://sunearth.gsfc.nasa.gov/spaceweather/FlexApp/bin-debug/index.html
________________________________________________________________
Myself as well
Heres a few of my favorites
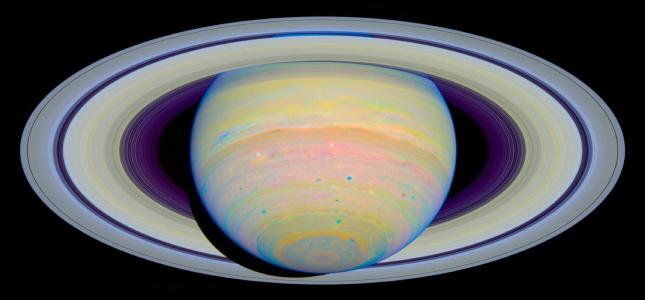 Incredible shot of Saturn
http://hubblesite.org/newscenter/archive/releases/2003/23/image/b/ - http://hubblesite.org/newscenter/archive/releases/2003/23/image/b/
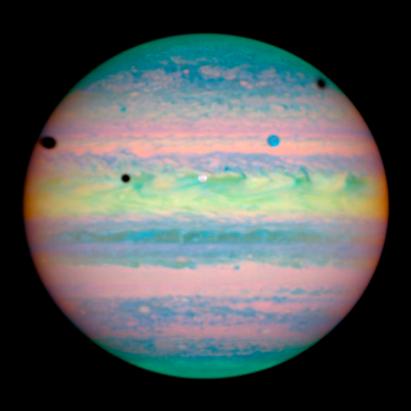 A rare alignment of three of Jupiter's largest moons
http://hubblesite.org/newscenter/archive/releases/2004/30/image/a/ - http://hubblesite.org/newscenter/archive/releases/2004/30/image/a/
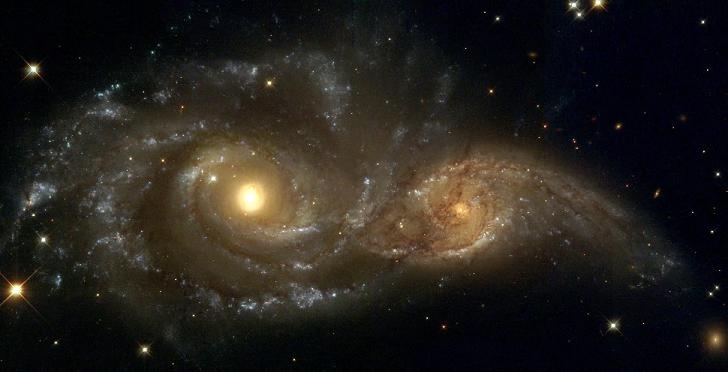 Two spiral galexies that appear to be colliding but are actually just passing by each other.
http://hubblesite.org/newscenter/archive/releases/2004/45/image/a/ - http://hubblesite.org/newscenter/archive/releases/2004/45/image/a/
------------- "In a time of universal deceit, telling the truth is a revolutionary act." G Orwell |
Posted By: Mahshadin
Date Posted: March 19 2010 at 11:36am
Very interesting SJF53
There are Lots of pieces to the puzzle
thanks ------------- "In a time of universal deceit, telling the truth is a revolutionary act." G Orwell |
Posted By: Hotair
Date Posted: March 19 2010 at 12:32pm
| I am so sorry, Turbo! Your leg must of been in a really wierd position to do all that damage. So how are planning your revenge? |
Posted By: Turboguy
Date Posted: March 19 2010 at 6:14pm
Naw, if you're laying on your side with your legs crossed just above the ankles and have a 265 lb beefcake fall on your foot and you too can enjoy a trimalleolar break. I dunno, but since he really didn't mean to, and I kinda slipped and kicked his legs out from under him so at worst I can do something funny, not quite painful. Awesome sites and pick Mahshadin. |
Posted By: Mahshadin
Date Posted: March 20 2010 at 8:13am
NOAA: U.S. Winter and February Cooler Than AverageMarch 10, 2010 NOAA�s State of the Climate report for the winter season (December through February) and the month of February, state that temperatures were below normal for the contiguous United States. The winter season was wetter than normal; however precipitation in February alone was slightly below average. Based on data going back to 1895, the monthly analyses, prepared by scientists at http://www.ncdc.noaa.gov - NOAA�s National Climatic Data Center in Asheville, N.C., are part of the climate services that NOAA provides to businesses, communities and governments so they may make informed decisions to safeguard their social and economic well-being. U.S. Temperature Highlights
U.S. Precipitation Highlights
Other Highlights
Background information on this winter�s snowstorms and the links to climate change is available online: http://www.noaa.gov/features/02_monitoring/index.html - http://www.noaa.gov/features/02_monitoring/index.html . NCDC�s preliminary reports, which assess the current state of the climate, are released soon after the end of each month. These analyses are based on preliminary data, which are subject to revision. Additional quality control is applied to the data when late reports are received several weeks after the end of the month and as increased scientific methods improve NCDC�s processing algorithms. Scientists, researchers, and leaders in government and industry use NOAA�s monthly reports to help track trends and other changes in the world's climate. This climate service has a wide range of practical uses, from helping farmers know what and when to plant, to guiding resource managers with critical decisions about water, energy and other vital assets. NOAA understands and predicts changes in the Earth�s environment, from the depths of the oceans to surface of the sun, and conserves and manages our coastal and marine resources. http://www.noaanews.noaa.gov/stories2010/20100310_cooler.html - http://www.noaanews.noaa.gov/stories2010/20100310_cooler.html
------------- "In a time of universal deceit, telling the truth is a revolutionary act." G Orwell |


Posted By: Mahshadin
Date Posted: March 20 2010 at 8:34am
|
Short-term Cooling on a Warming Planet There IS a problem with global warming, one headline recently quipped, it stopped in 1998. Making the same argument about declining temperatures since 1998, another headline proclaimed, Alarmists still heated even as world cools. These articles suggest that climate scientists have misled the public. While climatologists warn that greenhouse gas emissions from burning fossil fuels are warming our planet, some people argue that Earth is actually cooling: they point to declining temperatures since 1998 as proof that global warming has stopped. But this argument about global cooling begs an important question: Why measure temperatures since 1998? Why not 1997 or 1999? 
Global temperature anomalies from 1992 through 2008 as estimated by the Hadley Centre. Temperatures are shown as the difference from the 1961-1990 average. The colored lines drawn on the graph illustrate how temperatures for 1997, 1998, and 1999 compare to 2008. The answer might lie in the fact that 1998 was arguably the warmest year on record. The reason we had such a warm 1998 is that we had a very, very strong El Nino, probably one of the strongest El Ninos of the twentieth century, explains David Easterling, Chief of the Scientific Services Division at NOAAs National Climatic Data Center. If you have a very strong El Nino an extensive swath of the oceans surface with much-warmer-than-average temperatures that tends to warm the globally averaged air surface temperature. If global temperatures from subsequent years are compared to those of 1998, warming since that time is certainly difficult to detect. Easterling himself pointed out in a 2009 paper that a linear trend line from 1998 to 2008 shows no statistically significant trend up or down. While a straight line drawn from 1998 to 2008 does indicate that 2008 was cooler, a line from 1999 to 2008 shows that the planet warmed, and a line from 1997 to 2008 is almost flat. But Easterling doesnt advocate starting the measurements from either of those years. Instead, he suggests looking at the bigger picture. 
David Easterling of NOAA�s National Climatic Data Center. The bottom line is that current temperatures are way above the long-term average, Easterling says. The United Kingdoms Met Office and the World Meteorological Organization concur; in December 2009, the organizations described the first decade of the twenty-first century as by far the warmest on record. 
Average global temperature anomalies by decade, estimated by the Hadley Centre, shown as the difference from the 1961 � 1990 average. Vertical lines indicate the upper and lower 95% uncertainty ranges for each decade. The cooling argument is challenged even further in that not every estimate pegs 1998 as the warmest year. One group of climate researchers instead finds 2005 to be the warmest year. The difference doesn�t result from error or whim, but from the inherent difficulty in measuring global temperatures. The Challenge of Measuring the Past
Michael Schlesinger, of the University of Illinois at Urbana-Champaign. Michael Schlesinger is a professor in the Department of Atmospheric Sciences at the University of Illinois at Urbana-Champaign, and he has devoted almost four decades to studying global climate. He has worked extensively with global temperature records, and he recognizes their limitations. “The observations of temperature over Earth were not made for the purpose of climate, they were made for the purpose of weather,” he says. People naturally built weather stations where weather conditions would affect human activity, which excluded sparsely populated or rarely traveled areas. The addition of new weather stations over the years has enhanced recent temperature records, but not historical records. Meanwhile, some older weather stations have been moved, for instance, from city centers to airports. More importantly, the weather stations have focused on land even though oceans cover 70 percent of our planet. “Earth is unique in our solar system in that it has an ocean,” Schlesinger explains. “The atmosphere stirs the ocean by wind, and as warm surface waters mix with cooler waters below, they take heat away from the surface. This reduces the amount of surface warming that would occur if Earth were all land.” This complicates the task of calculating a representative average temperature for the entire globe, and different research groups choose different methods to account for the complexities. “If you had the ability to uniformly distribute thermometers over the planet, and gather measurements from this regular grid, then I think everybody would analyze the data in the same way,” Schlesinger says. On our real world, however, climatologists must work with “a hodgepodge of measurements over the continents.” Not surprisingly, climatologists have developed more than one approach to understanding historical temperature records based on weather station measurements. 
Global temperature anomalies estimated by NASA’s Goddard Institute for Space Studies (GISTEMP) and the UK Met Office and the University of East Anglia’s Climatic Research Unit (HadCRUT3). The consistently higher temperature indicated by GISTEMP is the result of the two groups measuring anomalies from different base periods: GISTEMP values show how much the world has warmed compared to the average from 1951 – 1980 while HadCRUT3 values show the change from the 1961 – 1990 average. Differences in how each group calculates global temperature result in differences in each year’s ranking. HadCRUT3 lists 1998 as the warmest year, followed by 2005 and 2003. GISTEMP shows 2005 as the warmest year, followed by 2007 and 1998. Two of the world’s foremost global temperature data sets are from the Hadley Centre in the United Kingdom, and the NASA Goddard Institute for Space Sciences (GISS) in the United States. Both groups use a combination of land-surface air temperature and sea-surface temperature records, incorporated from satellite observations and historical records, to calculate values for global temperature. Though the groups use different equations in processing the data, they do so consistently so their successive values indicate how global temperature has changed over time. One area that has experienced some of the most dramatic warming in recent years—but lacks permanent weather stations—is the Arctic, and the Hadley Centre and GISS handle the lack of observations in the region differently. The Hadley Centre offers a data set that works only with existing temperature measurements, essentially excluding the Arctic from its global temperature calculations. GISS offers a data set that accounts for Arctic temperatures by interpolating from the surrounding region. Like the Arctic, the high-latitude region around it has seen greater rates of warming than the global average over the last decade, including substantial warming in 2005. As a result, the Hadley data set identifies 1998 as the warmest year on record whereas the GISS data set identifies 2005 as the warmest year on record. “It’s a question of whether you interpolate or not, and different people handle it differently,” observes Easterling. “There’s no exactly right or wrong way.” And his overriding conclusion remains: Recent years rank among the warmest on record. Deciphering Natural Variability“There are two components influencing temperatures over time,” Easterling says. “You have a trend due to increasing greenhouse gases and you have natural variability superimposed on that trend.” Beyond our control, natural variability includes large-scale oceanic changes affecting regional and global temperatures. Cooling between 2006 and 2008, for instance, has likely been driven by La Niña. Opposite of El Niño conditions, the area of cooler-than-average sea surface temperatures that defines La Niña conditions can push global temperatures downward, if the phenomenon is strong enough. Schlesinger, who has served as a co-author for the Intergovernmental Panel on Climate Change, knows quite a bit about natural variability. In 1994, he described the Atlantic Multi-decadal Oscillation, an alternating pattern of heat-distributing ocean circulation that brings warmed waters from the tropics to high latitudes. “On average, ocean circulation transports a petawatt of heat,” Schlesinger explains. “A petawatt is the numeral 1 with 15 zeros after it, or a million billion watts of heat energy. If you could just acquire one percent of that heat, you could satisfy all your energy needs for planet Earth.” One cycle of the oscillation takes about 65 to 70 years. Over that time, the amount of heat moved northward along the western side of the North Atlantic Ocean waxes and wanes, increasing and decreasing temperatures in the North Atlantic Ocean and the surrounding continental margins. Although not directly dictated by this decades-long phenomenon, global temperatures are influenced by the oscillation, just as average temperatures can be driven up or down by El Niño and La Niña events. The transport of such a massive quantity of heat helps explain some counterintuitive temperature trends during the twentieth century. Despite the increase in greenhouse gas concentrations that began in the mid-1800s, between 1850 and 1900, global temperatures showed little significant change. Between 1900 and 1940, temperatures rose. After 1940, temperatures declined for 35 years. The lack of a direct correlation between greenhouse gas concentration and global temperature over this time span “was confounding understanding of the observed temperature record,” Schlesinger recalls, “and it was allowing people to make the argument, ‘If there was this early twentieth-century warming when humanity was putting relatively fewer greenhouse gases into the atmosphere, why wasn’t there a larger temperature increase later when humanity was putting vastly more greenhouse gases into the atmosphere?’ By discovering this oscillation, we were able to refute this argument.” 
This graph shows Global Average Temperature compared with the Atlantic Multi-decadal Oscillation (AMO) Index. The AMO Index is the average sea-surface temperature over the North Atlantic Ocean. The roughly parallel curves of the two parameters show that they are related: the increase in global temperature over time, coincident with the increase in greenhouse gases observed since the Industrial Revolution, is alternately obscured and enhanced by the AMO. Like Schlesinger, Easterling is also familiar with natural variability, and his knowledge of such variability caused him to question the cooling-since-1998 argument. Working with his co-author Michael Wehner, Easterling examined both observed temperatures and model simulations. Confident that the “cooling” was a short-term trend, Easterling wanted to see if he could find periods of no trend or with slight cooling over other time spans. He could. For observed temperatures, Easterling relied on a data set generated by NOAA’s National Climatic Data Center, incorporating globally averaged surface air temperatures from 1901 to 2008. In that data set, he found two periods—1977 to 1985 and 1981 to 1989—that showed slight cooling, similar to what appears in the Hadley Centre’s data set from 1998 to 2008. 
Global temperature anomalies calculated by NOAA for 1975 through 2008. Despite the long-term warming trend evident in the graph at the bottom, global temperature decreased slightly from 1977 to 1985 and from 1981 through 1989, as shown by blue arrows in the insets. Graph modified from Easterling, 2009. For model simulations, Easterling used a database of predicted temperatures, validated by its ability to retroactively “predict” temperatures for years past. He assumed a “business-as-usual” scenario in terms of greenhouse gas emissions, with little future reduction. When projecting temperatures for the twenty-first century, he found two more periods—2001 to 2010 and 2016 to 2031—that showed no trend, again similar to 1998 to 2008. Every one of these no-trend periods occurred against a backdrop of rising temperatures. “The supposed cooling is really a non-issue,” Easterling explains. “It’s just natural variability.” What the Future May HoldEasterling’s finding that natural variability can cause short-term cooling, or no-trend periods within longer-term warming, correlates with other predictions about future temperatures. In May 2008, a group of climate modelers in Germany published projections that incorporated current understanding of natural cycles to make a climate forecast for the next decade. The group forecast that global surface temperatures might not increase much over the next decade, as cooling driven by natural variability offsets human-caused warming. After a decade or so of stability, however, the model indicates that temperatures would begin to rise. In contrast, the UK Met Office predicted warming beginning in a few years from 2009. Both groups, however, agreed that after a short period of negative or no trend in the early 2000s, global temperatures would begin to rise, perhaps quickly. In other words, the no-trend period in the Hadley Centre’s data set not only doesn’t surprise these climatologists, it’s consistent with what they have predicted. “You’re going to see these episodes where you don’t get warming in the surface air temperature and then it starts back warming very strongly,” Easterling says. “If it kept cool for the next 25 years, I’d think maybe I was wrong,” Easterling continues, “but you can see periods as long as 16 years in our model run where temperatures stay the same without changing the long-term trend.” http://www.climatewatch.noaa.gov/wp-content/uploads/2009/12/npseaice_ams_2009255.png">
 http://www.climatewatch.noaa.gov/wp-content/uploads/2009/12/npseaice_ams_2009255_palette.png"> Each year, the area covered by Arctic sea ice melts to its smallest extent by the end of summer in September. This map shows the median extent of sea ice during September from 1979-2000 (in yellow), and the minimum extent observed in 2009. Image courtesy of NASA Earth Observatory and National Snow and Ice Data Center. The National Snow and Ice Data Center also offers an http://nsidc.org/images/arcticseaicenews/20091005_Figure6.mov - animation of images showing ice extent each September from 1979 to 2009 . Besides global temperatures, other lines of evidence point strongly to a warming planet. Since 1998, the extent of Arctic sea ice reached new record lows in 2002, 2005, and 2007. Arctic sea ice retreated so dramatically in 2007 that it broke all previous records a month before the end of melt season. And dramatic changes haven’t been unique to the Arctic. In 2002, some 3,250 square kilometers of the Larsen B Ice Shelf on the Antarctic Peninsula shattered over a period of just five weeks. In the wake of the ice shelf disintegration, glaciers feeding the shelf accelerated on their route into the Weddell Sea. “The reason people believe strongly that Earth has warmed is not just the temperature record, but all these other things,” Easterling explains. http://www.climatewatch.noaa.gov/wp-content/uploads/2010/02/seaice_min_max_2009_465px.jpg">

Maximum Arctic sea ice extent for 2009 occurred in March, and minimum Arctic sea ice extent occurred in September 2009. In each image, the magenta line indicates the median extent of ice cover for that month for the period 1979–2000. /wp-content/uploads/2010/02/seaice_min_max_2009.jpg - View larger version in a new window . Images courtesy of http://nsidc.org/data/seaice_index/ - National Snow and Ice Data Center. http://www.climatewatch.noaa.gov/wp-content/uploads/2010/02/seaice_min_max_trends_465px.jpg">

Both minimum and maximum sea ice extents have decreased over the period of satellite observation. This graph shows the trends in minimum extent (red) and maximum extent (black) from 1979–2009 as the percentage difference in ice extent compared to the mean from 1979-2000. /wp-content/uploads/2010/02/seaiceextent_min_max_trends.jpg - View larger version in a new window . Graph courtesy of http://www.arctic.noaa.gov/reportcard/seaice.html - Arctic Report Card . http://www.climatewatch.noaa.gov/wp-content/uploads/2010/02/seaice_age_thickness.png">

The colors on these maps show Arctic sea ice distribution in March 2007, 2008, and 2009. Multiyear ice is shown as white, mixed ice is aqua, first-year ice is teal, and ice with melting on the surface is red. Dark blue represents open water and gold is land. These images were prepared using a combination of satellite observations and drifting ice buoys. Courtesy of Son Nghiem and http://www.arctic.noaa.gov/reportcard/seaice.html - Arctic Report Card . “When you’re in a court of law, you have to swear to tell the truth, the whole truth, and nothing but the truth. The people who have been focusing on the ‘cooling’ have not been telling the whole truth,” Schlesinger remarks. “Natural variability may mask the effects of greenhouse gas emissions in the short term, but once an oscillation changes back to a mode that increases global temperatures, it will reinforce the effects of burning fossil fuels, and we could face a double whammy. So the worst mistake we could make is to confuse short-term cooling for a reversal of global warming.” http://www.climatewatch.noaa.gov/2009/articles/short-term-cooling-on-a-warming-planet - http://www.climatewatch.noaa.gov/2009/articles/short-term-cooling-on-a-warming-planet
------------- "In a time of universal deceit, telling the truth is a revolutionary act." G Orwell |
Posted By: Mahshadin
Date Posted: March 20 2010 at 9:19am
NOAA: Imminent Flood Threat in Midwest, South and East Also at RiskMarch 16, 2010 Major flooding has begun and is forecast to continue through spring in parts of the Midwest according to NOAAs National Weather Service. The South and East are also more susceptible to flooding as an El Nino influenced winter left the area soggier than usual. Spring 2010 Flood Risk map.
(Credit: NOAA) Overall, more than a third of the contiguous United States has an above average flood risk with the highest threat in the Dakotas, Minnesota and Iowa, including along the Red River Valley where crests could approach the record levels set just last year. Supporting the forecast of imminent Midwest flooding is a snowpack more extensive than in 2009 and containing in excess of 10 inches of liquid water in some locations. Until early March, consistently cold temperatures limited snow melt and runoff. These conditions exist on top of: above normal streamflows; December precipitation that was up to four times above average; and the ground which is frozen to a depth as much as three feet below the surface. Its a terrible case of deja vu, but this time the flooding will likely be more widespread. As the spring thaw melts the snowpack, saturated and frozen ground in the Midwest will exacerbate the flooding of the flat terrain and feed rising rivers and streams, said Jane Lubchenco, Ph.D., under secretary of commerce for oceans and atmosphere and NOAA administrator. We will continue to refine forecasts to account for additional precipitation and rising temperatures, which affect the rate and severity of flooding. In the South and East, where an El Nino-driven winter was very wet and white, spring flooding is more of a possibility than a certainty and will largely be dependent upon the severity and duration of additional precipitation and how fast existing snow cover melts, said Jack Hayes, Ph.D., director of the National Weather Service. Though El Nio is forecast to continue at least through spring, its influence on day-to-day weather should lessen considerably. Without a strong El Nino influence, climate forecasting for spring (April through June) is more challenging, but NOAAs Climate Prediction Center says odds currently favor wetter-than-average conditions in coastal sections of the Southeast; warmer-than-average temperatures across the western third of the nation and Alaska; and below-average temperatures in the extreme north-central and south-central U.S. The Rockwell Aero Commander (AC-500S) is one of the aircrafts used by NOAAs National Hydrologic Remote Sensing Center to collect snow data to develop accurate flood forecasts.
Meteorologists and hydrologists with the National Weather Service issue timely and accurate flood forecasts and warnings from local weather forecast offices and regional river forecast centers across the nation. They constantly monitor precipitation, temperature, snowpack and waterway levels using a network of gauges, some of which are operated by vital partners such as the U.S. Geological Survey, and using NOAA aerial surveys of snowpack and its water content. The National Weather Service provides a suite of decision support services ranging from direct briefings with emergency management agencies at all levels to its graphical Advanced Hydrologic Prediction Service available at weather.gov/water. This is also national http://www.noaanews.noaa.gov/stories2010/20100315_flood.html - Flood Safety Awareness Week . Floods are the deadliest weather phenomena claiming an average of 100 lives annually. Many of these deaths occur in automobiles and are preventable. If confronted with a water-covered road on foot or in an automobile, follow National Weather Service advice: Turn Around, Dont Drown. NOAA understands and predicts changes in the Earth's environment, from the depths of the ocean to the surface of the sun, and conserves and manages our coastal and marine resources. http://www.noaanews.noaa.gov/stories2010/20100316_springoutlook.html - http://www.noaanews.noaa.gov/stories2010/20100316_springoutlook.html
------------- "In a time of universal deceit, telling the truth is a revolutionary act." G Orwell |

Posted By: Turboguy
Date Posted: March 20 2010 at 11:22am
|
I have a lot of family out in the Red River area of Minnesota and they're flooded out every single year. Some of them even bought land on the flood plain! When they told me about it I was flabbergasted! Why the hell would you buy land and build a house on the flood plain? It's not called a flood plain for nothing! Now they're scrambling to save their house. They need to move their house and just have a family garden where the house is now. |
Posted By: mrmouse
Date Posted: March 20 2010 at 12:33pm
|
"But hey everythings good right, especially if your at the top of that pyramid scheme. You even get the Government (The People) to fight the wars to secure your supply & Contracts."
Gerald says it so well! http://eclipptv.com/viewVideo.php?video_id=10844 |
Posted By: Mahshadin
Date Posted: March 20 2010 at 1:38pm
|
rmouse Good video, although I dont agree with some of politics.Hey if you click and put your insertion point at the end of that link and then hit enter it will fuction as a link.
The whole bit on Wages (Right On). We have been told every mythical story about free trade or fair trade as reasons for the removal of 30 or so percent of our manufacturing base and now there seems to be an awakening to the reality (It was just GEED)
I would write more but I volunteered to do a health fair today so must get going
Thanks, very good vid ------------- "In a time of universal deceit, telling the truth is a revolutionary act." G Orwell |
Posted By: Mahshadin
Date Posted: March 20 2010 at 10:00pm
|
Excelent site for accurate and up to date information on the climate
Temperatures
http://www.ncdc.noaa.gov/sotc/?report=global#precip - Precipitation
http://www.ncdc.noaa.gov/sotc/?report=global#seaice - Sea Ice
http://www.ncdc.noaa.gov/sotc/?report=global#gsnow - NH Snow Cover
http://www.ncdc.noaa.gov/sotc/?report=global#tropo - Troposphere
http://www.ncdc.noaa.gov/sotc/?report=global#strato - Stratosphere
http://www.ncdc.noaa.gov/sotc/?report=global - http://www.ncdc.noaa.gov/sotc/?report=global
NOAA Climate Services Site
http://www.climate.gov/#climateWatch - http://www.climate.gov/#climateWatch
------------- "In a time of universal deceit, telling the truth is a revolutionary act." G Orwell |
Posted By: Mahshadin
Date Posted: March 21 2010 at 7:59am
|
TurboGuy
Here is one that anyone who loves astronomy will want to see
http://www.youtube.com/watch?v=NN4qAeo-3WU&NR=1 - http://www.youtube.com/watch?v=NN4qAeo-3WU&NR=1
For more information
http://www.imax.com/hubble/ - http://www.imax.com/hubble/
------------- "In a time of universal deceit, telling the truth is a revolutionary act." G Orwell |
Posted By: Turboguy
Date Posted: March 21 2010 at 10:58am
| Yeah I had heard about that and it looks amazing. I think that's the one where they almost got held up on their multi million dollar mission for a forty cent screw that wasn't coming loose. |
Posted By: Mahshadin
Date Posted: March 21 2010 at 4:39pm
_____________________________________________________________________
I agree with most of what you said TG. The problem comes in where did we go wrong and why did we do it. The Energy Industry was almost completely De-Regulated (By Who ?). And make no mistake when you deregulate an industry that control (Power) does not disappear it simply gets shifted and in this case that meant into Corporate Hands. Now don’t get me wrong, I totally agree with our free market system, but there has to be balance. This Industry has received billions and billions of dollars from .gov (The People) in the form of R & D. Without this intervention much of this industry would not exist, its just not profitable to drill 500 holes in the ground and only have one or two produce energy. We accept this in many parts of our society because it is the only way for our Free Market system to be feasible and there is nothing wrong with this. But to say we (The People) should give up all control when quite frankly many of these Corps would not exist without our generous subsidies is just plain wrong. In my opinion our current mess started with the energy crisis (Transportation Costs or Fossil Fuels Rising 30 to 50 percent). It just took a couple of years for the effects to hit every industry and the end result was inevitable (Without Control). In my opinion it was completely inexcusable for this same industry to be collecting 43 billion in profits (One Corporation) for one quarter (3 months) during this same period of time. We all spend our hard earned money helping these Corps succeed where they could not possibly afford to spend all of that R & D money to get to a point of profitability, not to mention Securing those places around the globe that provide that Crude like Iraq, Kuwait, Saudi Arabia, and others with our Military. We basically turned over the keys to a Corps whos only mission is to make more money every quarter with no other regard for the effects on the nation who paid for much of their success and continue to pay, thus walking us all off the cliff eventually as the ripple effect rolled through our Fossil Fuel Driven Economy. I also remember this same time everyone screaming why is .gov doing nothing (WOW), why because we intentionally handed over our control in the name of de-regulation (Misplaced Blame). Government (The People) were pretty much powerless (We paid for a seat at the table and then willingly gave it up). I believe accountability is important, and just like in our own lives if we never accept responsibility for our mistakes we are doomed to repeat them again and again. To have an industry so large that they can literally decide the fate of the entire economy without any control or regulation is just inexcusable. Just my opinion.
______________________________________________________________________ Of course you would as would many Americans. I don’t know about you but I didn’t receive a 35 percent raise to cover my new 30 to 50 percent higher transportation expenses as well as natural gas electricity, and others. I actually made an educated guess that that was coming and bought a Prius before the Shiiit hit the Fan. I remember the looks I would get at the gas station which I only visited once a month sometimes twice. And when prices went over $4.00 I parked my Wifes large SUV except for large family transports and drove the Prius almost everywhere we needed to go. When gas went over $4.50 my salesman from We must take this Fossil Fuel thing seriously or we will just end up another Empire swept under the carpet because we were to stubborn to change. We import roughly 1,900,000 barrels of oil a Day (Yes Day). To put this in perspective, each barrel produces roughly 42 gallons of usable petro (Gas). That’s roughly the equivalent of burning up 80,000,000 (Million) gallons of gas a DAY, 28,000,000,000 (Billion) gallons a year, or roughly a 200 square mile lake of petro 1 foot deep a year. And that’s just this country. This just is not sustainable, not to mention choking ourselves, our childrfen and the planet in the process
Did you expect anything different after putting 2 oil men into the Whitehouse (I didn’t). As far as the bailout of Chevy, I am not sure we could have afforded to give up that much manufacturing without severe consequences. The void would be filled with foreign Corps with the money flowing out of the country, not to mention all of the supporting Just my opinons ------------- "In a time of universal deceit, telling the truth is a revolutionary act." G Orwell |
Posted By: Mahshadin
Date Posted: March 21 2010 at 6:39pm
|
NASA's AIM Satellite and Models are Unlocking the Secrets of Mysterious "Night-Shining" Clouds
12.15.09
Goddard Space Flight Center, Greenbelt, Md. 301-286-4647 mailto:cynthia.m.ocarroll@nasa.gov - cynthia.m.ocarroll@nasa.gov Goddard Release: 09-88 http://www.nasa.gov/images/content/411170main_AIM-PMC-orig.jpg">  This image of Polar Mesospheric Clouds (PMC) from the Aeronomy of Ice in the Mesosphere Cloud Imaging and Particle Size (AIM-CIPS) instrument on July 14, 2009 in the northern polar region. The North Pole (90N) is in the center. Latitude bands of 80N, 70N, and 60N are also indicated by the light blue circles. This image of Polar Mesospheric Clouds (PMC) from the Aeronomy of Ice in the Mesosphere Cloud Imaging and Particle Size (AIM-CIPS) instrument on July 14, 2009 in the northern polar region. The North Pole (90N) is in the center. Latitude bands of 80N, 70N, and 60N are also indicated by the light blue circles. Credit: NASA GREENBELT, Md. -- NASA's Aeronomy of Ice in the Mesosphere (AIM) satellite has captured five complete polar seasons of noctilucent (NLC) or "night-shining" clouds with an unprecedented horizontal resolution of 3 miles by 3 miles. Results show that the cloud season turns on and off like a "geophysical light bulb" and they reveal evidence that high altitude mesospheric "weather" may follow similar patterns as our ever-changing weather near the Earth's surface. These findings were unveiled today at the Fall Meeting of the American Geophysical Union today in San Francisco.
The AIM measurements have provided the first comprehensive global-scale view of the complex life cycle of these clouds, also called Polar Mesospheric Clouds (PMCs), over three entire Northern Hemisphere and two Southern Hemisphere seasons revealing more about their formation, frequency and brightness and why they appear to be occurring at lower latitudes than ever before. "The AIM findings have altered our previous understanding of why PMCs form and vary," stated AIM principal investigator Dr. James Russell III of Hampton University in Hampton, Va. "We have captured the brightest clouds ever observed and they display large variations in size and structure signifying a great sensitivity to the environment in which the clouds form. The cloud season abruptly turns on and off going from no clouds to near complete coverage in a matter of days with the reverse pattern occurring at the season end." These bright "night-shining" clouds, which form 50 miles above Earth's surface, are seen by the spacecraft's instruments, starting in late May and lasting until late August in the north and from late November to late February in the south. The AIM satellite reports daily observations of the clouds at all longitudes and over a broad latitude range extending from 60 to 85 degrees in both hemispheres. The clouds usually form at high latitudes during the summer of each hemisphere. They are made of ice crystals formed when water vapor condenses onto dust particles in the brutal cold of this region, at temperatures around minus 210 to minus 235 degrees Fahrenheit. They are called "night shining" clouds by observers on the ground because their high altitude allows them to continue reflecting sunlight after the sun has set below the horizon. They form a spectacular silvery blue display visible well into the night time. Sophisticated multidimensional models have also advanced significantly in the last few years and together with AIM and other space and ground-based data have led to important advances in understanding these unusual and provocative clouds. The satellite data has shown that: 1. Temperature appears to control season onset, variability during the season, and season end. Water vapor is surely important but the role it plays in NLC variability is only now becoming more understood, 2. Large scale planetary waves in the Earth's upper atmosphere cause NLCs to vary globally, while shorter scale gravity waves cause the clouds to disappear regionally; 3. There is coupling between the summer and winter hemispheres: when temperature changes in the winter hemisphere, NLCs change correspondingly in the opposite hemisphere. Computer models that include detailed physics of the clouds and couple the upper atmosphere environment where they occur with the lower regions of the atmosphere are being used to study the reasons the NLCs form and the causes for their variability. These models are able to reproduce many of the features found by AIM. Validation of the results using AIM and other data will help determine the underlying causes of the observed changes in NLCs. The AIM results were produced by Mr. Larry Gordley and Dr. Mark Hervig and the Solar Occultation for Ice Experiment (SOFIE) team, Gats, Inc., Newport News, Va. and Dr. Cora Randall and the Cloud Imaging and Particle Size (CIPS) experiment team, University of Colorado, Laboratory for Atmospheric and Space Physics in Boulder and Dr. Scott Bailey, Va. Tech, Blacksburg, Va.; Modeling results were developed by Dr. Daniel Marsh of the National Center for Atmospheric Research in Boulder, Colorado and Professor Franz-Josef L�bken of the Leibniz-Institute of Atmospheric Physics, K�hlungsborn, Germany. AIM is a NASA-funded SMall EXplorers (SMEX) mission. NASA's Goddard Space Flight Center manages the program for the agency's Science Mission Directorate at NASA Headquarters in Washington. The mission is led by the Principal Investigator from the Center for Atmospheric Sciences at Hampton University in VA. Instruments were built by the Laboratory for Atmospheric and Space Physics (LASP), University of Colorado, Boulder, and the Space Dynamics Laboratory, Utah State University. LASP also manages the AIM mission and controls the satellite. Orbital Sciences Corporation, Dulles, Va., designed, manufactured, and tested the AIM spacecraft, and provided the Pegasus launch vehicle. http://www.nasa.gov/mission_pages/aim/news/nlc-secrets.html - http://www.nasa.gov/mission_pages/aim/news/nlc-secrets.html
------------- "In a time of universal deceit, telling the truth is a revolutionary act." G Orwell |
Posted By: Turboguy
Date Posted: March 21 2010 at 10:50pm
Here's the problem with this logic: If I create a product, let's call it Turbo's Super-Widget that cures cancer, male pattern baldness, PMS, and stupidity and there are zero bad side effects aside from making users of the Super-Widget ridiculously good looking. Instantly I will sell literally billions of Widgets, billions. Nobody will be able to live without them! Even if I make a slice of a penny per Widget I'll still make billions and billions of dollars because I'm the proprietor of a newly necessary commodity. What people don't realize is that oil companies make pennies, PENNIES, per gallon on their product. The Government reaps by far the lion's share of the oil company's product's sales. There is no comparison! Every gallon of gasoline sold here in the State of Minnesota has a state tax of nearly seventy cents per gallon (It's actually a percentage, but I don't know exactly what it is.) The Feds get right around 45 - 60 cents per gallon of gasoline and seemingly nobody has any problem with that whatsoever. Then the Federal Government taxes the profits of the oil companies *AND* the amount the gas stations pay just to buy from the oil companies in the first place. If anything is obscene, it's the amount that the government takes from the oil companies, and for what? With the amount that the government gets from the oil companies alone they could make gas at the pump free. |
Posted By: Mahshadin
Date Posted: March 22 2010 at 8:19pm
TG although I enjoyed your comparison immensely (All Beautiful People), its not really the same, heres why Although the widget sounds like an instant success it is a Want item not a need item. A large increase in price would not crash our entire economy and we could probably live with a few Ugly, Bald Idiots) LoL Oil on the other hand is a need, our entire economy is based on it from agriculture to retail. Any large increase in price has the potential to ripple through every part of the economy, including the price of the new widget and tank the whole thing, as we experienced, and are still reeling from (See Any State Budget). As far as the whole (Were beating up on the Oil Companies theme), I just do not agree. Oil is a need, which also makes it a National Security Item. I think its more like a partnership, especially at this point where most of the oil we consume comes from Foreign Soil. When you look at the whole picture you will find the Oil Industry gets quite the Bang for their buck (Literally) from .Gov (The People) via a very large stick, not to mention the R & D subsidies and infrastructure to keep this industry conveniently accessible to all Americans (No Gas-No Go). As far as the tax stuff, well the federal 18.4 Cents has remained the same for almost 20 years. States well that’s a different beast with each one deciding their own policies. Your state 27 Cents is about average as is mine. ____________________________________ On a lighter note, is the widget a one time cure (Sotaspeak) or does it just treat the symptoms? ------------- "In a time of universal deceit, telling the truth is a revolutionary act." G Orwell |
Posted By: Turboguy
Date Posted: March 22 2010 at 8:25pm
|
The Widget would be something that only treats the symptoms. If you made it a one time thing we couldn't get people hooked for their entire lives. Remember the first one's free! |
Posted By: Mahshadin
Date Posted: March 22 2010 at 8:52pm
|
------------- "In a time of universal deceit, telling the truth is a revolutionary act." G Orwell |
Posted By: Mahshadin
Date Posted: March 24 2010 at 8:13pm
|
Taking the "Surprise" out of Surprise Solar Storms
Scientists are learning to predict giant solar storms that could, at any time, hit the Earth and produce cascading catastrophes March 18, 2010
From Sept. 1 to 2, 1859, the sun blasted out a massive, record-breaking coronal mass ejection (CME)--a huge eruption of highly charged gases and plasma that may have weighed as much as a billion tons. Racing through the solar system at several million miles per hour, the CME eventually collided with the Earth's magnetosphere--an invisible, atmospheric cocoon surrounding the planet that is filled with charged particles controlled by the Earth's magnetic field. Hit by the CME, the Earth's magnetosphere temporarily went into a haywire state known as a geomagnetic storm. The result: skies were set ablaze all over the world with technicolor auroras that reached as far south as Cuba and El Salvador, and blew out global telegraph systems, the highest-tech communication devices of the day. The 1859 geomagnetic storm, called the Carrington Storm, was the largest geomagnetic storm ever recorded. "But there is absolutely no reason why the Earth couldn't be hit by an equally or even more violent geomagnetic storm today, tomorrow, or the next day," said Sarah Gibson of the National Center for Atmospheric Research (NCAR) in Boulder, Colo. Because the Carrington storm occurred during relatively low-tech times, the havoc it unleashed provided but a tame preview of what would happen if a contemporary Carrington-like storm were to hit our technology-dependent society. In fact, according to a report by the National Academy of Sciences, a contemporary Carrington-like storm could trigger cascading catastrophes, including melted transformers that could shut down large, interconnected power grids, power outages affecting as many as 130 million people, backed-up sewage systems, the failure of electronic transportation systems, and the collapse of systems used to distribute drinking water, food, medicines and fuel. But a geomagnetic storm would not even have to reach Carrington's record-breaking strength to cause serious damage. In recent years, weaker geomagnetic storms have damaged technological systems like satellites, increased the radiation exposure of astronauts, disrupted communication and navigation systems and knocked out power to large populations. CMEs are associated with peaks in the activity of sunspots, which are knots of magnetism on the sun's surface generated by subsurface movements of solar material. (Sunspots appear dark because they are cooler and therefore less bright than their hotter surroundings.) Sunspot activity peaks about every 11 years; this 11-year cycle is, in turn, related to a 22-year cycle of reversals in the sun's magnetic field. During a typical 11-year sunspot cycle, the sun hurls about 100 severe CMEs and about four extreme CMEs into the solar system--only a fraction of which usually hit the Earth. Such CMEs are most likely to occur during peaks in sunspot activity, and are less likely to occur during periods of low sunspot activity. "But," warns Gibson, "CMEs still occur during periods of low sunspot activity; but they are just fewer and further between than during active sunspot periods. And so it is still very possible for a fierce geomagnetic storm to occur during a solar minimum." Because scientists vigilantly watch for CMEs through high-tech telescopes and because it usually takes two or three days for most of a CME's impacts to reach the Earth, scientists can anticipate geomagnetic storms once Earth-directed CMEs start. Nevertheless, scientists cannot yet forecast when CMEs will start. With funding from the National Science Foundation, scientists at NCAR are currently using various methods to improve their understanding of CMEs and their ability to forecast them. Among these methods are computer simulations of CMEs that describe their physical properties based on conditions on the sun and Earth and the laws of magnetism, electricity, gravity and thermodynamics--as shown in the above image and an http://www.nsf.gov/cgi-bin/goodbye?http://www.vets.ucar.edu/vg/SME/index.shtml - animated simulation of a CME. Some simulations are based on hypothetical data that is designed to reflect typical solar events. But other simulations are based on specific data collected on a particular day and are designed to recreate actual CMEs. Data incorporated into such simulations may include, for example, the Earth's position relative to the sun during the CME; the mass, composition, size and electrical charge of the CME; and conditions immediately around the Earth upon the CME's arrival. By comparing their simulation with direct observations of the real-life CME it was designed to recreate, scientists can evaluate their simulation's accuracy and improve it. This Discovery article was previously provided to http://www.nsf.gov/cgi-bin/goodbye?http://www.livescience.com/ - LiveScience in partnership with the National Science Foundation. Investigators Animation
http://www.vets.ucar.edu/vg/SME/index.shtml - http://www.vets.ucar.edu/vg/SME/index.shtml
http://www.nsf.gov/discoveries/disc_summ.jsp?cntn_id=116594&org=NSF - http://www.nsf.gov/discoveries/disc_summ.jsp?cntn_id=116594&org=NSF
------------- "In a time of universal deceit, telling the truth is a revolutionary act." G Orwell |
Posted By: Technologist
Date Posted: March 24 2010 at 9:16pm
Chemotherapy and a suntan for everyone! |
Posted By: Mahshadin
Date Posted: March 24 2010 at 9:28pm
|
Wont need a tanning booth that week
------------- "In a time of universal deceit, telling the truth is a revolutionary act." G Orwell |
Posted By: Mahshadin
Date Posted: March 24 2010 at 10:00pm
|
When Glaciers Melt, What's in the Water?
Measuring the movement of nutrients in Alaska's glacial streams is a "hot topic" for an NSF-supported research team March 17, 2010
Being on top of an Alaskan glacier was not as cold as Michael Nassry expected. Nassry grew up hunting, fishing, hiking and camping in western Pennsylvania, near his home in Hopwood. "I like the outdoors," he said. With that motivation, he decided he wanted to be an environmental engineer, and found himself in the agricultural and biological engineering program at Penn State University, where he focused on soils and water research. Now a doctoral student in biological systems engineering at Virginia Tech, he has fine-tuned his interest to nutrient transport in rivers and streams. "I look at what is taken up, what is used, what is passed through to down-river systems," he said, referring to the nutrients in waterways that exercise tremendous control over whether aquatic life thrives, or collapses. He is guided in this focus by his advisor, Durelle "Scotty" Scott. "Scotty has a lot of projects going on, but I was attracted to the Alaska project because I haven't had a lot of exposure to glacial systems," Nassry said. "What is happening to these watersheds is a hot topic." "Within a small area, you can examine watersheds that range in glacial coverage," Scott said. "This allows us to look at how these systems respond to climate change." Nassry traveled to Alaska with Scott and undergraduate student Andrew Jeffrey, who has since graduated, to join Eran Hood, associate professor of hydrology at the University of Alaska Southeast, and his two students, for two weeks in July 2009. It was all part of Scott's NSF-funded research to measure the movement of nutrients out of glaciers. All of the study sites were close to, and accessible from, Juneau, and the July period, when the glaciers are melting, offered better weather for the helicopters carrying the researchers to the glacier tops. In addition to the milder-than-expected temperatures, Nassry was surprised at how quickly the ice melted around the ground covers the scientists slept on. "When we picked up the tarp, the ice underneath was about an inch higher than the surrounding ice." Nassry also noticed a lot of streams on top of the glacier, some of them large. "I didn't expect so much surface flow," he added. "I thought more melt would be through the ice." The research team was atop the ice to perform an injection experiment. First, they put dye in a stream so they could measure its speed. The next day, for three hours straight, they injected a salt solution and several other solutions containing nutrients into the stream. The team then collected water samples at three downstream locations, after the injection pumps were turned off, to determine what flowed out and what was absorbed. Nassry's jobs were to calibrate the injection pumps and collect background samples above the injection point. The task and clean-up took until 10 or 11 p.m., by which time the helicopters had quit for the day, so the researchers slept on the ice--or not. "It was so bright, I couldn't sleep at all," Nassry said. Hood had been prepared for the overnight and provided the sleeping bags. The one Nassry used came complete with teddy bear, having previously been used by Hood's young daughter. The next task was to sample the base of the different watersheds, some of which had more glacial coverage than others. "For the Lemon Glacier, Andrew, Eran, Scotty and I were dropped at the face by a helicopter early in the morning; then, we sampled and hiked the whole length of Lemon Creek--six to eight hours," Nassry said. "Scotty and Andrew biked up a path to the Herbert glacier and sampled the stream on the way back. And Eran and I hiked a trail at http://waterdata.usgs.gov/ak/nwis/uv/?site_no=15052800&PARAmeter_cd=00065,00060 - Montana Creek and sampled on the way down. That only took a few hours," Nassry said. The Mendenhall River is shrinking at a far more rapid pace, as evidenced by data from its stream http://waterdata.usgs.gov/ak/nwis/uv/?site_no=15052500&PARAmeter_cd=00065,00060 - gauges . "Eran analyzed samples for carbon in his lab and shipped us the remaining samples," Nassry said. "In Scotty's lab, we're measuring nutrients, carbon, anions and water isotopes. We used a U.S. Geological Survey computer model, called OTIS, to simulate the downstream flow of water and salts along the reach. Once we achieved a calibrated model for the salts, we knew the hydrology--or what the water was doing. Our next step is to apply the model to each of the biologically available nutrients added during the injection experiment." In summer 2010, the researchers, including Nassry, will work in streams between the glaciers and the gulf. "This spring," Nassry said, "I'll be designing those experiments and testing them in Stroubles Creek [near the Virginia Tech campus]." And when they head back, the summer 2010 team will include a local K-12 teacher so that she can learn what it's like to do environmental research--experiences she can share with other teachers and her students. -- Susan Trulove, Virginia Tech, mailto:STrulove@vt.edu - STrulove@vt.edu This Behind the Scenes article was provided to http://www.nsf.gov/cgi-bin/goodbye?http://www.livescience.com/ - LiveScience in partnership with the National Science Foundation. Investigators ------------- "In a time of universal deceit, telling the truth is a revolutionary act." G Orwell |
Posted By: Turboguy
Date Posted: March 25 2010 at 8:54pm
Because you work with electronics as I do, those solar storms are of significant interest to me as they are something that not only directly impacts my military employment, but something tangible that I can see/hear. Thankfully our magnetic field would protect us from a wicked sunburn and genetic damage, but man would it make my job hard! I can't imagine what would happen if we had a planetwide pulse event the likes of which a CME would bring. IIf America alone were hit by something like that it would literally take years to get us back to before, were it even possible! If it were planetwide you can pretty much stick a fork in it because I don't think we'd be coming back in a lifetime. |
Posted By: Mahshadin
Date Posted: March 25 2010 at 9:16pm
|
A picture I posted on the other site
Puts things in perspective (Awsome Power of the Sun)
 ------------- "In a time of universal deceit, telling the truth is a revolutionary act." G Orwell |
Posted By: Mary008
Date Posted: March 25 2010 at 10:32pm
|
Mahs.. really enjoy this thread. |
Posted By: Mahshadin
Date Posted: March 26 2010 at 9:26pm
|
Kewl Mary008 I was starting to wonder?Also fun, the sheer amount af data that is available on the subject is amazing, especially in the last 6 months to a year. ------------- "In a time of universal deceit, telling the truth is a revolutionary act." G Orwell |
Posted By: Mahshadin
Date Posted: March 27 2010 at 7:19am
|
The Origin and Impacts of Ocean Acidification Videos, Sun, Mar 21st, 2010 Richard Feely discusses new findings about how increased carbon dioxide in the atmosphere is making the oceans more acidic, and how that will affect ocean ecosystems and the marine animals that inhabit them. http://www.climatewatch.noaa.gov/2010/videos/origin-impacts-ocean-acidification - |
Posted By: Mary008
Date Posted: March 27 2010 at 9:20am
|
.
:) ( ahh rural life, keeps one too busy )
so Kewl in fact... had to check into it>
More info/ photos of that awesome power of the sun.
http://www.nasa.gov/centers/goddard/news/topstory/2003/1028soho.html - http://www.nasa.gov/centers/goddard/news/topstory/2003/1028soho.html
That flare we see up there in your post...
caused this >
Credit: NASA/University of Iowa The coronal mass ejection swept past Earth today triggered an intense geomagnetic storm. The northern lights were visible as far south as Arkansas, Texas and Oklahoma. ............... |

Posted By: Mahshadin
Date Posted: March 27 2010 at 7:37pm
|
Quite the show from below Ill bet. Thats one thing I miss about living back north, the occassional Northern Lights. ------------- "In a time of universal deceit, telling the truth is a revolutionary act." G Orwell |
Posted By: Mahshadin
Date Posted: March 27 2010 at 7:39pm
|
NASA Study Finds Atlantic 'Conveyor Belt' Not Slowing
03.25.10
 Illustration depicting the overturning circulation of the global ocean. Throughout the Atlantic Ocean, the circulation carries warm waters (red arrows) northward near the surface and cold deep waters (blue arrows) southward. Image credit: NASA/JPL Illustration depicting the overturning circulation of the global ocean. Throughout the Atlantic Ocean, the circulation carries warm waters (red arrows) northward near the surface and cold deep waters (blue arrows) southward. Image credit: NASA/JPL PASADENA, Calif. – New NASA measurements of the Atlantic Meridional Overturning Circulation, part of the global ocean conveyor belt that helps regulate climate around the North Atlantic, show no significant slowing over the past 15 years. The data suggest the circulation may have even sped up slightly in the recent past. Alan Buis
http://www.nasa.gov/topics/earth/features/atlantic20100325.html - http://www.nasa.gov/topics/earth/features/atlantic20100325.html
------------- "In a time of universal deceit, telling the truth is a revolutionary act." G Orwell |
Posted By: Mahshadin
Date Posted: March 28 2010 at 9:09am
|
Unrelated to Climate change, but very interesting stuff on NASA and future plans of lunar/planet exploration (LSS).
______________________________________________________________
The vision of NASA LSS (Lunar Surface Systems) http://www.youtube.com/watch?v=4nfsAosbsX0&feature=related - http://www.youtube.com/watch?v=d1bR-wXvyAs&playnext_from=TL&videos=5Rx_NOqkUME&playnext=1 - NASA (GEO LAB) http://www.youtube.com/watch?v=1tzmED_TvFc&playnext_from=TL&videos=5Rx_NOqkUME&playnext=1 - NASA (Tri Athlete Field Test) http://www.youtube.com/watch?v=X3-NRmdFARc&feature=channel - NASA (Athlete Field Test) http://www.youtube.com/watch?v=zgozjwyUnnk&feature=channel - NASA Chariot B (Rock Climbing Test) http://www.youtube.com/watch?v=gOIAv_yZl5o&feature=channel - NASA LER (Lunar Electric Rover) http://www.youtube.com/watch?v=mpAYes8F88U&feature=related - |
Posted By: Mahshadin
Date Posted: March 28 2010 at 11:41am
|
NASA/NOAA
GOES-P
Is it really worth it to spend all of this money on satelites to see what the weather is going to be?
http://www.nasa.gov/mp4/435837main_G10-027_GOESwTopper_ipods.mp4 - |
Posted By: mrmouse
Date Posted: March 28 2010 at 11:41am
|
I wonder if there's any connection?
Bees in more trouble than ever after bad winter! http://news.yahoo.com/s/ap/20100324/ap_on_sc/us_food_and_farm_disappearing_bees - news.yahoo.com/s/ap/20100324/ap_on_sc/us_food_and_farm_disappearing_bees What in the World Are They Spraying? http://farmwars.info/?p=2590 - farmwars.info/?p=2590 |
Posted By: Mahshadin
Date Posted: March 29 2010 at 5:21pm
|
Interesting article on the bees, boy do we need to find out the answer to this one. Not just the bees but bats and other polinators. ------------- "In a time of universal deceit, telling the truth is a revolutionary act." G Orwell |
Posted By: Mary008
Date Posted: March 29 2010 at 7:03pm
|
(trying to keep up :)
some bees and a bird died at the side of our house (no chem use ) One of the Bees is floating in a small jar of Vodka in my kitchen...there is a place near us that wants to test birds/bees that die suddenly.
More on the Conveyor Belt (above post )
..................................................................
Interesting... changing climate
Listen to streaming Audio...
http://science.nasa.gov/headlines/y2004/05mar_arctic.htm - http://science.nasa.gov/headlines/y2004/05mar_arctic.htm
http://www.anl.gov/OPA/frontiers/d8ee2.html"> Above: A global ocean circulation between deep, colder water and warmer, surface water strongly influences regional climates around the world. Image courtesy Argonne National Laboratory. [ http://www.anl.gov/OPA/frontiers/d8ee2.html - More ] ............................................................................................................................................
The Day the World Didn't End listen > http://science.nasa.gov/headlines/y2008/10oct_lhc.htmlisten - http://science.nasa.gov/headlines/y2008/10oct_lhc.htmlisten............. |

Posted By: Mahshadin
Date Posted: March 29 2010 at 7:24pm
Mysterious bat-killing illness previously seen in the U.S. now in OntarioThe Canadian Press - ONLINE EDITION
By: THE CANADIAN PRESS
19/03/2010 4:04 PM | TORONTO - A mysterious illness that has killed upwards of 500,000 bats in the northeastern United States has now been detected in the animals in Ontario. The Ministry of Natural Resources is confirming the first case of bats with a disease known as white-nose syndrome in the Bancroft-Minden area, in eastern Ontario. It is unknown exactly how the syndrome kills bats, but some researchers think the fungus acts as an irritant, causing the bat to awaken from its hibernation period early and often. That leads the animals to burn through their energy reserve and starve to death. There is no known human health risk associated with this illness, but it has been linked to the deaths of a small number of bats in Ontario. People are asked to stay away from caves and abandoned mines where bats may be present, and to avoid touching bats, whether living or dead, as a small percentage carry rabies. White-nose syndrome got its name from the smudges of white fungus that appear around the nose, mouth and wings of the affected animal. It was first documented in Albany, N.Y., in the winter of 2006. Since then, the syndrome has spread across nine states in the northeastern U.S. and has wiped out anywhere from 75 to 98 per cent of the overwintering bat population. Ontario says it will continue monitoring for the syndrome until bats leave hibernation sites in May. http://www.winnipegfreepress.com/life/health/mysterious-bat-killing-illness-previously-seen-in-the-us-now-in-ontario-88664817.html - http://www.winnipegfreepress.com/life/health/mysterious-bat-killing-illness-previously-seen-in-the-us-now-in-ontario-88664817.html
------------- "In a time of universal deceit, telling the truth is a revolutionary act." G Orwell |
Posted By: Mahshadin
Date Posted: March 29 2010 at 9:43pm
New Science Shows Carbon Storage Potential of U.S. LandsU.S. Geological Survey scientists have found that the lower 48 states in the U.S. presently store 73 billion metric tons of carbon in soils and 17 billion metric tons in forests. This is equivalent to more than 50 years of America�s current CO2 emissions from burning fossil fuels. The http://pubs.usgs.gov/of/2009/1283/ - national assessment of biologic carbon sequestration estimates there is the potential to store an additional 3-7 billion metric tons of carbon in forests, if agricultural lands were to be used for planting forests. This potential is equivalent to 2 to 4 years of America�s current CO2 emissions from burning fossil fuels. America�s forests and soils currently absorb about 30 percent (0.5 billion metric tons of carbon) of the nation�s fossil fuel emissions per year (1.6 billion metric tons of carbon). Enhancing the carbon storage capacity of America�s and the world�s ecosystems is an important tool to reduce carbon emissions and help ecosystems adapt to changing climate conditions. �The tools the USGS is developing�and the technologies behind those tools�will be of great use to communities around the world that are making management decisions on carbon storage,� said http://www.doi.gov/bio/McNutt_bio2.htm - USGS Director Marcia McNutt . �The USGS is conducting a national assessment of biologic carbon sequestration, as well as an assessment of ecosystem carbon and greenhouse gas fluxes, which will help determine how we can reduce atmospheric CO2 levels while preserving other ecological functions.� To determine how much more carbon could be stored in forests and soils, USGS scientists analyzed maps that represent historical vegetation cover before human alterations, as well as maps of vegetation that might occur if there were no natural disturbances, such as fires, pests and drought. These maps were compared to maps of current vegetation and carbon storage. The next phase of this work will assess the additional amount of carbon stored in Alaska's ecosystems, including its soils and forests. http://www.doi.gov/news/Carbon-Storage-Potential.cfm - http://www.doi.gov/news/Carbon-Storage-Potential.cfm
------------- "In a time of universal deceit, telling the truth is a revolutionary act." G Orwell |
Posted By: Mahshadin
Date Posted: April 01 2010 at 10:18pm
|
Extreme Weather Impacts Migratory Birds
03.29.10
 http://www.nasa.gov/images/content/436001main_bird_lg.jpg - > View larger image http://www.nasa.gov/images/content/436001main_bird_lg.jpg - > View larger image More than 20 years after the red cockaded woodpecker suffered population losses due in part to major destruction of a critical habitat, the longleaf pine ecosystem, during category 5 storm Hugo in 1989, the U.S. Fish and Wildlife Service continues efforts to save them. The woodpeckers, on the endangered species list for more than 2 decades, are found now in 11 southern states in the U.S. Credit: U.S. Fish and Wildlife Service Every year, hurricanes and droughts wreak havoc on human lives and property around the world. And according to a pair of new NASA-funded studies, migratory birds also experience severe impacts to their habitats and populations from these events. While this may not seem like a revelation, the researchers were surprised to find that migratory bird species located as far as 60 miles (100 kilometers) from a hurricane�s path had experienced a long-term loss in population. Those populations took up to five years to rebound from the damage to their forest environments. At the same time, researchers found that some migratory bird species could experience population losses as high as 13 percent when rainfall levels fall dramatically and cause drought in plains regions. The studies appear in the March edition of Global Change Biology. "These studies suggest that whether a hurricane or a drought batters an area, migratory habits -- whether birds migrate south or stay put after breeding season -- are a strong predictor of how birds will fare," said Anna Pidgeon, an avian ecologist at the University of Wisconsin-Madison and a NASA-funded co-author of both studies. "We believe changes in weather and climate are fundamental drivers of migration but, until now, we�ve known little of how changes in climate compel changes in migratory patterns," said Woody Turner, manager of the biodiversity program at NASA�s Headquarters in Washington. "The correlations don�t necessarily mean the environment alone is forcing migratory changes, but they offer a good place to start looking." Wings of Change Pidgeon and other researchers see birds as excellent indicators of overall environmental health. Birds can give advance notice of ecosystem changes that will affect humans in time, while also telling us about the broader impacts of our actions. Pidgeon, along with colleagues from NASA, the U.S. Department of Agriculture's Forest Service, the University of Maryland-College Park, and the University of Wisconsin-Madison, grouped 77 bird species into "migratory guilds." The guilds were based on similar migratory habits: birds that migrate long distances (to the tropics or subtropics), short distances, or reside solely in one location; breeding habitats: urban, semi-arid, or water-based habitats; the type of nests they construct; and whether they nest on or close to the ground or in tree canopies. At the outset, researchers believed intuitively that hurricanes would cause losses among tree nesters due to a wipe-out of habitat from downed trees. That would bring gains for ground- and shrub nesters because of the increase in ground vegetation and nesting resources.  http://www.nasa.gov/images/content/436003main_migratory_birds_lg.jpg - > View larger image http://www.nasa.gov/images/content/436003main_migratory_birds_lg.jpg - > View larger image Data from hundreds of weather stations dotting the central U.S. in the left image illustrate the amount of rainfall estimated during a 16-week period in winter-spring 2000. Areas in red indicate a shortfall (drought) that affected bird populations more so than reduced vegetation. Red areas show less greenness � therefore less vegetation -- in the right image, a condition that prevailed in the region at the start of the year�s growing season. Credit: Tom Albright/University of Wisconsin-Madison Pidgeon�s research team examined five Gulf and Atlantic Coast areas affected by hurricanes between 1984 and 2005. They used population and diversity data from the North American Breeding Bird Survey, tracks of hurricanes, and a time-series of digital images from the NASA-built Landsat remote sensing satellite. When matched to data on breeding seasons, the scientists found that destruction of habitat correlated with varying degrees of distress on the bird species. Habitat destruction caused losses in abundance and diversity across all species in the season following hurricanes, which persisted as long as five years. Hurricanes pose no immediate danger to bird conservation, Pidgeon believes, provided there remains ample and suitable forest habitat to which birds can shift in the aftermath of a major storm. Grass Not Always Greener for Birds In a separate study, Pidgeon and colleagues identified periods of drought and their subsequent impact on bird species. They started with a measure of the amount and quality of refuge for birds -- the Normalized Difference Vegetation Index (NDVI), which assesses the seasonal "greenness" of the landscape. The method involves using data from a satellite-based radiometer that measures the color of the landscape in different wavelengths according to a plant�s ability to absorb radiation. The stronger the reflectance of wavelengths off Earth�s surface, the greater density of green leaves on the ground. When they compared this "greenness" against 15 years of precipitation data from 1,600 weather stations across the plains of North America, the team found that precipitation is a better means of forecasting bird survival during drought. "Rows of corn may be a sign of vegetation when viewed in a satellite image, but they don�t help protect birds during a drought because they�re not essential habitat," Pidgeon explained. Whether researchers considered bird species together or in groups, according to whether they stay in an area all year versus spending the winter to the south, they always found that precipitation, rather than "greenness," was more strongly associated with species diversity and abundance. "Satellite remote sensing is helping us see and analyze the ecological impact of these events on bird populations, as well as marine species and mammals," says climatologist Bill Patzert of NASA�s Jet Propulsion Laboratory in Pasadena, Calif. "Ultimately, however, hurricanes, drought, and other influences act as part of natural selection." http://www.nasa.gov/topics/earth/features/migratory-birds.html - http://www.nasa.gov/topics/earth/features/migratory-birds.html
------------- "In a time of universal deceit, telling the truth is a revolutionary act." G Orwell |
Posted By: Mahshadin
Date Posted: April 01 2010 at 11:06pm
|
http://www.jwst.nasa.gov/resources/pbs.mov -
The next generation Space Telescope from Nasa
 Intro (Video)
http://anon.nasa-global.edgesuite.net/anon.nasa-global/ccvideos/GSFC_20100323_jwsttrailer.asx - Detailed (Video) http://www.jwst.nasa.gov/resources/pbs.mov - - http://www.jwst.nasa.gov/resources/pbs.mov
Web Cam of Construction
http://www.jwst.nasa.gov/webcam.html - http://www.jwst.nasa.gov/webcam.html
Home page
http://www.jwst.nasa.gov/index.html - http://www.jwst.nasa.gov/index.html
------------- "In a time of universal deceit, telling the truth is a revolutionary act." G Orwell |
Posted By: Mahshadin
Date Posted: April 02 2010 at 8:09am
|
Interesting images from TRACE (10 plus years observing our sun)
TRACE, is a mission of the Stanford-Lockheed Institute for Space Research, and part of the NASA Small Explorer program
TRACE Science Objectives
   http://trace.lmsal.com/ - http://trace.lmsal.com/
------------- "In a time of universal deceit, telling the truth is a revolutionary act." G Orwell |

Posted By: Mahshadin
Date Posted: April 02 2010 at 9:27am
|
Road Transportation Emerges as Key Driver of Warming in New Analysis from NASA
02.18.10

Motor vehicles give off only minimal amounts of sulfates and nitrates, both pollutants that cool climate, though they produce significant amounts of pollutants that warm climate such as carbon dioxide, black carbon, and ozone. Credit: NASA's Langley Research Center 
The on-road transportation sector releases significant amounts of carbon dioxide, black carbon, and ozone�all substances that cause warming. In contrast, the industrial sector releases many of the same gases, but it also tends to emit sulfates and other aerosols that cause cooling by reflecting light and altering clouds. Credit: NASA GISS/Unger 
Unger's model finds that in 2020 (left), transportation, household biofuels and animal husbandry will have the greatest warming impact on the climate, while the shipping, biomass burning, and industrial sectors will have a cooling impact. By 2100 (right), the model finds that the power and industrial sector will become strongly warming as carbon dioxide accumulates. Credit: NASA GISS/Unger 
Unger's analysis is one of the first of its kind to incorporate the multiple effects that aerosol particles can have on clouds, which affect the climate indirectly. Credit: NASA's Johnson Space Center Now a new study led by Nadine Unger of NASA's Goddard Institute for Space Studies (GISS) in New York City offers a more intuitive way to understand what's changing the Earth's climate. Rather than analyzing impacts by chemical species, scientists have analyzed the climate impacts by different economic sectors. Each part of the economy, such as ground transportation or agriculture, emits a unique portfolio of gases and aerosols that affect the climate in different ways and on different timescales. "We wanted to provide the information in a way that would be more helpful for policy makers," Unger said. "This approach will make it easier to identify sectors for which emission reductions will be most beneficial for climate and those which may produce unintended consequences." In a paper published online on Feb. 3 by the Proceedings of the National Academy of Sciences, Unger and colleagues described how they used a climate model to estimate the impact of 13 sectors of the economy from 2000 to 2100. They based their calculations on real-world inventories of emissions collected by scientists around the world, and they assumed that those emissions would stay relatively constant in the future. Snapshots of the Future In their analysis, motor vehicles emerged as the greatest contributor to atmospheric warming now and in the near term. Cars, buses, and trucks release pollutants and greenhouse gases that promote warming, while emitting few aerosols that counteract it. The researchers found that the burning of household biofuels -- primarily wood and animal dung for home heating and cooking -- contribute the second most warming. And raising livestock, particularly methane-producing cattle, contribute the third most. On the other end of the spectrum, the industrial sector releases such a high proportion of sulfates and other cooling aerosols that it actually contributes a significant amount of cooling to the system. And biomass burning -- which occurs mainly as a result of tropical forest fires, deforestation, savannah and shrub fires -- emits large amounts of organic carbon particles that block solar radiation. The new analysis offers policy makers and the public a far more detailed and comprehensive understanding of how to mitigate climate change most effectively, Unger and colleagues assert. "Targeting on-road transportation is a win-win-win," she said. "It's good for the climate in the short term and long term, and it's good for our health." Due to the health problems caused by aerosols, many developed countries have been reducing aerosol emissions by industry. But such efforts are also eliminating some of the cooling effect of such pollution, eliminating a form of inadvertent geoengineering that has likely counteracted global warming in recent decades. "Warming should accelerate as we continue to remove the aerosols," said Unger. "We have no choice but to remove the aerosol particulate pollution to protect human and ecosystem health. That means we'll need to work even harder to reduce greenhouse gases and warming pollutants." By the year 2100, Unger's projections suggest that the impact of the various sectors will change significantly. By 2050, electric power generation overtakes road transportation as the biggest promoter of warming. The industrial sector likewise jumps from the smallest contribution in 2020 to the third largest by 2100. "The differences are because the impacts of greenhouse gases accumulate and intensify over time, and because they persist in the atmosphere for such long periods," said Unger. "In contrast, aerosols rain out after a few days and can only have a short-term impact." Factoring in Clouds For each sector of the economy, Unger's team analyzed the effects of a wide range of chemical species, including carbon dioxide, nitrous oxide, methane, organic carbon, black carbon, nitrate, sulfate, and ozone. The team also considered how emissions from each part of the economy can impact clouds, which have an indirect effect on climate, explained Surabi Menon, a coauthor of the paper and scientist at the Lawrence Berkeley National Laboratory in Berkeley, Calif. Some aerosols, particularly sulfates and organic carbon, can make clouds brighter and cause them to last longer, producing a cooling effect. At the same time, one type of aerosol called black carbon, or soot, actually absorbs incoming solar radiation, heats the atmosphere, and drives the evaporation of low-level clouds. This process, called the semi-direct aerosol effect, has a warming impact. The new analysis shows that emissions from the power, biomass burning, and industrial sectors of the economy promote aerosol-cloud interactions that exert a powerful cooling effect, while on-road transportation and household biofuels exacerbate cloud-related warming. More research on the effects of aerosols is still needed, Unger cautions. "Although our estimates of the aerosol forcing are consistent with those listed by the International Panel on Climate Change, a significant amount of uncertainty remains." http://www.nasa.gov/topics/earth/features/road-transportation.html - http://www.nasa.gov/topics/earth/features/road-transportation.html
------------- "In a time of universal deceit, telling the truth is a revolutionary act." G Orwell |
Posted By: Mahshadin
Date Posted: April 02 2010 at 1:22pm
|
Second March Northeastern U.S. Flooding Event Covered in 'GOES' Movie
New England received a second week of flooding from March 21-31, 2010 when a parade of three large storms flooded the upper Midwest and Northeast in the second half of the month. The Geostationary Operational Environmental Satellite called GOES-12 captured a movie of those storms as they dumped heavy rainfall during the last 10 days of March.
http://www.nasa.gov/mp4/438231main_100321-31.floods.mp4 - |
Posted By: Turboguy
Date Posted: April 02 2010 at 2:34pm
|
Those images of the sun two posts ago are incredible! I can't imagine the amount of Gauss it must take to drag that much solar plasma that far, or just to drag it in the first place! I've held some incredibly powerful magnets in my day. Working with powerful Radars and their associated magnetron magnets gave me a newfound respect for their power. We had one that came out of a very very powerful pencil radar.Pencil means that it is a very narrow beam. Anyway, we had one that was somewhere near 100,000 gauss or some amount of insane power. Basically once it got attached to something metal it took more than 200 pounds to remove it. If you walked into a room full of CRT televisions or computer monitors iit would screw up all the colors. If you actually touched the monitor, it was screwed permanently and no amount of the degauss function could fix it. I was messing around with my five year old niece, sticking magnets to the hardware in my leg. She thought it was the coolest thing she's ever seen. She pulled out one of these neodymium magnets that I've got stashed and was going to put it on myleg. When she got within three feet of my leg I felt the tug. I was afraid that I might not get it off or that it'd pull the stuff out if she got it there. |
Posted By: Mahshadin
Date Posted: April 02 2010 at 6:36pm
------------- "In a time of universal deceit, telling the truth is a revolutionary act." G Orwell |
Posted By: Mahshadin
Date Posted: April 03 2010 at 12:13pm
DOT, EPA Set Aggressive National Standards for Fuel Economy and First Ever Greenhouse Gas Emission Levels For Passenger Cars and Light Trucks
Release date: 04/01/2010 Contact Information: Cathy Milbourn Milbourn.cathy@epa.gov 202-564-7849 202-564-4355 NHTSA Press Office: 202-366-9550
WASHINGTON - Responding to one of the first major directives of the Obama Administration, the U.S. Department of Transportation (DOT) and the U.S. Environmental Protection Agency (EPA) today jointly established historic new federal rules that set the first-ever national greenhouse gas emissions standards and will significantly increase the fuel economy of all new passenger cars and light trucks sold in the United States. The rules could potentially save the average buyer of a 2016 model year car $3,000 over the life of the vehicle and, nationally, will conserve about 1.8 billion barrels of oil and reduce nearly a billion tons of greenhouse gas emissions over the lives of the vehicles covered. Full News Release:
http://yosemite.epa.gov/opa/admpress.nsf/bd4379a92ceceeac8525735900400c27/562b44f2588b871a852576f800544e01!OpenDocument - http://yosemite.epa.gov/opa/admpress.nsf/bd4379a92ceceeac8525735900400c27/562b44f2588b871a852576f800544e01!OpenDocument
------------- "In a time of universal deceit, telling the truth is a revolutionary act." G Orwell |
Posted By: Mahshadin
Date Posted: April 03 2010 at 7:33pm
|
Sometimes its just an amazing shot http://antwrp.gsfc.nasa.gov/apod/image/1003/pillarsofcreation_hst_big.jpg">
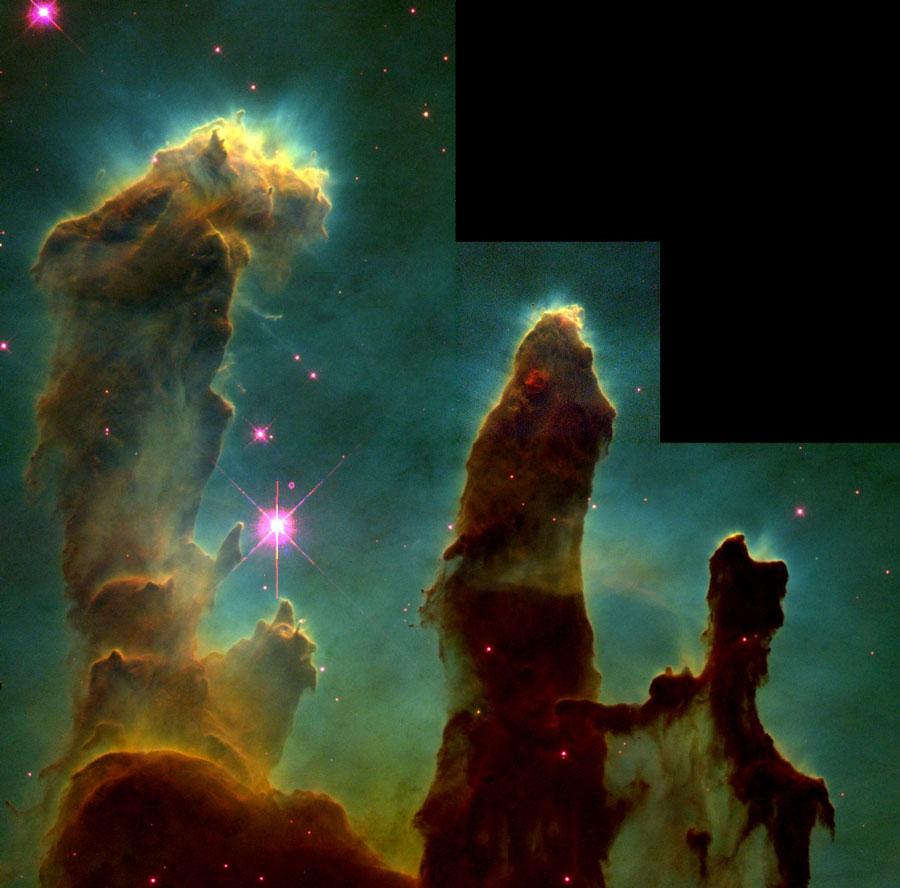 It has become one of the most famous images of modern times. http://hubblesite.org/newscenter/archive/releases/1995/44/ - This image , taken with the http://antwrp.gsfc.nasa.gov/apod/ap021124.html - Hubble Space Telescope in 1995, shows http://hubblesite.org/newscenter/archive/releases/1995/44/text/ - evaporating gaseous globules (EGGs) emerging from pillars of molecular http://antwrp.gsfc.nasa.gov/apod/ap010113.html - hydrogen gas and http://antwrp.gsfc.nasa.gov/apod/ap030706.html - dust . The http://antwrp.gsfc.nasa.gov/apod/ap970730.html - giant pillars are http://chandra.harvard.edu/photo/cosmic_distance.html - light years in length and are so dense that interior gas http://hyperphysics.phy-astr.gsu.edu/hbase/astro/gravc.html - contracts gravitationally to form stars. At each http://antwrp.gsfc.nasa.gov/apod/ap061022.html - pillars' end , the intense radiation of bright young stars causes low density material to boil away, leaving http://antwrp.gsfc.nasa.gov/apod/stellar_nurseries.html - stellar nurseries of dense http://en.wikipedia.org/wiki/Egg_%28biology%29 - EGGs exposed. The http://seds.lpl.arizona.edu/messier/m/m016.html - Eagle Nebula , associated with the http://antwrp.gsfc.nasa.gov/apod/open_clusters.html - open star cluster http://antwrp.gsfc.nasa.gov/apod/ap030921.html - M16 , lies about 7000 http://chandra.harvard.edu/photo/cosmic_distance.html - light years away. The http://en.wikipedia.org/wiki/Eagle_Nebula#.27Pillars_of_Creation.27_region - pillars of creation were again http://chandra.harvard.edu/photo/2007/m16/ - imaged by the orbiting http://chandra.harvard.edu/about/axaf_mission.html - Chandra X-ray Observatory , and it was found that most http://www.youtube.com/watch?v=dnDU7JJtVts - EGGS are not strong emitters of http://science.hq.nasa.gov/kids/imagers/ems/xrays.html - X-rays .
http://antwrp.gsfc.nasa.gov/apod/ap100328.html - http://antwrp.gsfc.nasa.gov/apod/ap100328.html
------------- "In a time of universal deceit, telling the truth is a revolutionary act." G Orwell |
Posted By: Mahshadin
Date Posted: April 04 2010 at 7:36am
|
More information on the (Smart Grid)
Argonne National Laboratory
http://www.youtube.com/watch?v=hkf_tA-Al1g - http://www.youtube.com/watch?v=hkf_tA-Al1g
Text Article
http://www.anl.gov/Media_Center/News/2010/news100325.html - http://www.anl.gov/Media_Center/News/2010/news100325.html
------------- "In a time of universal deceit, telling the truth is a revolutionary act." G Orwell |
Posted By: Mahshadin
Date Posted: April 04 2010 at 11:33am
|
DEFENSE: Accelerating Arctic changes pose long-term risks for the U.S. Navy (03/24/2010) Lauren Morello, E&E reporter LAUREL, Md. -- Climate change is poised to turn the Arctic into a new military frontier, but that doesn't mean it's likely thaw out as a new "Wild West." A Russian expedition made headlines in 2007 when it planted a Russian flag in an Arctic seabed, spurring headlines suggesting a new Cold War was imminent. But for the U.S. Navy, Marine Corps and Coast Guard, the challenge posed by climate change -- in the Arctic and beyond -- is more complex, long-term and tinged with uncertainty. "For the U.S. Navy, climate change is a challenge -- and not a crisis," said Rear Adm. David Titley, who is leading the Navy's Task Force Climate Change. "I would say that my Russian friends probably did us more help than anything by putting that flag on the North Pole. It got us to focus on the Arctic. But there was a great article in National Geographic that indicates that was kind of a tourist expedition." That doesn't mean there isn't reason for concern about changes in the high North. "The thing is that the Arctic is not a vacuum," Titley said yesterday at a conference at Johns Hopkins University's Applied Physics Lab. "What happens there will have repercussions in mid-latitude, and vice versa." That holds true for changes in the Arctic atmosphere and its geopolitics. Results from Navy war games suggest conflicts that arise in the far North may spread beyond the Arctic Circle, Titley said. But there are some factors that may temper the pace of change -- and its political and national security fallout. Take talk about new shipping routes that are likely to emerge as the Arctic thaws. In 2008, the long-sought Northwest Passage and Northern Sea Route were open simultaneously -- though briefly -- for the first time in recorded history. Search-and-rescue capability may set the pace Some cruise ships and even a few sailboats have been sighted in the Arctic in recent years. But Richard Engel, a retired Air Force major general who leads the National Intelligence Council's climate change program, said that even if Arctic summers are free of sea ice in the 2030s, shippers may not pounce immediately. Their operations will depend on putting in place infrastructure -- like search-and-rescue capability -- that is now absent. "It won't be quite as fast as people lead you to believe," Engel said. "It's commercial and economic interests that may slow it up a little bit." Debate over just how climate change will play out in the Arctic highlights the uncertainty faced by military planners who recognize climate change's disruptive potential. The Navy last year commissioned its first ship bearing a hybrid gas-electric drive, the USS Makin Island. And next month, on Earth Day, the force will conduct an airborne test of an F/A-18 aircraft powered by biofuels -- the "Green Hornet." But amid those concrete steps to reduce its dependence on fossil fuels that contribute to climate, the Navy is wrestling with more fundamental questions posed by climate change. "Uncertainty is very tightly linked with risk," said Jay Gulledge, senior scientist at the Pew Center on Global Climate Change. "And that's what the security implications of climate change is about -- risk, and how we're going to manage that risk." Generation-spanning issues Climate change is a complex problem that involves predicting changes in nonlinear systems, where even slight shifts in key variables can cause major shifts in outcomes. Adding to that, Gulledge said, is the fact that climate change is a problem that spans generations. The temptation for many people is ignoring the problem, because the risk seems hard to define or far off. Tackling that uncertainty head-on isn't simple. For Titley, who's heading a Navy task force shaping that force's response to climate change, one major problem is that current climate models make predictions on a continent-by-continent, not region-by-region, basis, at time scales well beyond the Navy's planning horizon. "The paradox with climate is, in some ways, the forecasts for 2100 are a lot more confident than the forecasts for 2013," he said. And science is developing rapidly. Last month, the Pentagon's Quadrennial Defense Review made headlines with its assessment that climate change has become a "threat multiplier" for the nation's armed forces. But experts noted that that review, mandated by Congress in the 2008 defense authorization bill, relied on middle-range predictions of future warming taken from the 2007 report by the Intergovernmental Panel on Climate Change. That science, in many cases, is already out of date. The IPCC predicted the world's seas would rise between 7 and 23 inches by 2100 -- but issued a giant caveat. The IPCC cautioned that an additional rise could come from rapid and unpredictable melting of massive ice sheets in Greenland and Antarctica, which it didn't attempt to estimate. Three years later, a crop of new scientific analyses paint a picture of 1 to 2 meters of sea level rise -- roughly 3 to 7 feet -- by the end of the century. Predictions become more severe But the quadrennial review, directed by Congress to rely on the IPCC's mid-range projections, didn't capture those recent scientific advances. The IPCC report, published in 2007, relied on analyses from 2005 or earlier. "Climate risks are loaded to the more severe side," Gulledge said. "It's more likely that we're underestimating than overestimating at this point." There are risks that may be overstated -- and potential threats that are true wild cards. Dabelko said he puts climate migration in the first category, as something that is frequently sensationalized. "There's a very large uncertainty with migration, but it can be a good thing," Dabelko said. "It can defuse conflict when people move. It really matters how it's done." "We are pushed to oversimplify," he said, offering blunt advice: "Embrace the uncertainty. The mindset and tools that the security community brings to this are very well positioned in terms of planning for the worse and hoping for the best." Meanwhile, there are the wild cards. One of them, according to the Navy's Titley, is shifting ocean chemistry. The world's seas help sop up carbon dioxide emissions, but as output of the greenhouse gas has risen, that has made ocean water more acidic. Scientists say that will cause problems for marine species -- including shellfish, corals, plankton and other marine animals -- that grow hard shells made of a chalky mineral called calcium carbonate. If ocean water becomes too acidic, it can begin dissolving those shells, sometimes faster than the creatures can rebuild them. Scientists at sea on ocean chemistry change "It's a wild card as to whether or not, or how, the living ecosystem, from tiny critters to big fish, is going to adapt," Titley said. "If they don't, we have to start asking ourselves where the 1 billion people today who get protein from the ocean are going to get that from." Experts also said they are eyeing talk of geoengineering closely, figuring that many of the proposed schemes to engineer a cooler planet have the potential to spark geopolitical havoc. One oft-mentioned geoengineering approach is to mimic the cooling effects of a volcano by spraying sulfate particles into the upper atmosphere, where they would increase the amount of sunlight reflected away from Earth. Scientists say it's cheap enough that a very wealthy individual or an individual nation might be able to act unilaterally and deploy the scheme without international oversight. "We know very little about this," said Geoff Dabelko, director of the Environmental Change and Security Program at the Woodrow Wilson Center. "It holds big potential for challenges in the political realm, the security realm, that we have not fully grappled with. ... It's not a stretch that the Navy would be asked to monitor or interdict these activities." Other potential wild cards, experts at the conference said, include the possibility that a climate-related push for new technology and new forms of energy will spur demand for a new set of natural resources in short supply. Increased production of electric car batteries, for example, is driving a new global hunger for lithium. Half the world's supply is found in Bolivia, whose president, Evo Morales, is an outspoken critic of the United States. http://www.pewclimatesecurity.org/news/accelerating-arctic-changes-pose-long-term-risks-for-us-navy/ - http://www.pewclimatesecurity.org/news/accelerating-arctic-changes-pose-long-term-risks-for-us-navy/
------------- "In a time of universal deceit, telling the truth is a revolutionary act." G Orwell |
Posted By: Mahshadin
Date Posted: April 04 2010 at 12:16pm
|
Great video showing time--lapsed photos of Ice Sheets (Several Glaciers Around The World)
http://www.youtube.com/watch?v=DjeIpjhAqsM - http://www.youtube.com/watch?v=DjeIpjhAqsM
Short version
http://www.youtube.com/watch?v=oaTcsyNrEec - http://www.youtube.com/watch?v=oaTcsyNrEec
------------- "In a time of universal deceit, telling the truth is a revolutionary act." G Orwell |
Posted By: Mahshadin
Date Posted: April 08 2010 at 7:56am
|
First Pic from new Weather and Climate Satelite GOES-P
 lhttp://www.nasa.gov/images/content/441048main_firstimage_g15v_ssec.jpg
http://www.nasa.gov/mission_pages/GOES-P/news/first-image.html - http://www.nasa.gov/mission_pages/GOES-P/news/first-image.html
------------- "In a time of universal deceit, telling the truth is a revolutionary act." G Orwell |
Posted By: Mahshadin
Date Posted: April 08 2010 at 8:07am
NOAA Scientists Peek at Places Pikas PopulateClimate Assessment on American Pika Habitat Reveals Warming Trend
American pika.(Credit: National Park Service) Unless you are an avid mountain hiker, you have probably never seen a pika. This small, furry relative of the rabbit relative lives in high, rocky, alpine areas. They have become a symbol of climate change impacts for some environmental groups. A Good Indicator of Habitat ChangeThe American pikas thrive in cool, rocky fields generally above the tree line in mountainous areas (usually between 8,000 – 13,000 ft). They eat plants and do not hibernate. Rather, they store hay to survive the long mountain winters. And aside from the occasional hiker, they rarely encounter humans. “Because of where they live, they are relatively unaffected by other human activities, but if climate change forces their preferred habitat upslope, populations could be left isolated, on ‘sky islands’ with nowhere to go.” says Andrea Ray, a physical scientist with NOAA’s Earth System Research Laboratory in Boulder, Colo. Climate Assessment Determines Species’ FutureAt the request of the U.S. Fish & Wildlife Service, Ray and NOAA partners from the University of Colorado’s Cooperative Institute for Research in the Environmental Sciences recently conducted a climate assessment for the pika — the first-ever for a non-marine mammal — to help the FWS decision on whether it should be listed as a threatened or endangered species.
American pika.(Credit: National Park Service) An endangered species designation can have broad environmental and economic impacts. They can boost dwindling animal populations and restrict hunting, logging and other human activities in the endangered species’ habitat. Earlier research, published in the Journal of Mammalogy in 2003, showed a decline in pika populations. It also raised concern that rising temperatures were threatening pikas with extinction. “We were approached by Fish and Wildlife to conduct a rapid review of the area’s climate that they could use in reviewing the pika’s status,” says Ray. “We brought different threads of scientific study together to bear on the particular problem and completed the report in about six months.” Pika Habitat is WarmingThe NOAA team assessed climate data and projections of change in the western United States and discovered a distinct warming trend and consistent projections of warming into the future. They found that by midcentury, the average summer temperatures will be about 5 degrees F warmer than in the recent past. That means that summer temperatures will equal or exceed the warmest summers of the recent past. Observations from Nevada and Oregon, for example, show statistically significant warming of 2-4 degrees F in summers over the past 30 years.
American pika.(Credit: National Park Service) The assessment brought together findings from the latest research, observations from a number of sources, studies of past climate, and global models to project future climate. NOAA’s rapid climate review for the pika was possible because the agency has monitored climate data in many parts of the world for many decades, and has ongoing research on climate at elevation, and applications of climate models. Ultimately, the Fish and Wildlife Service ruled in February 2010 that pikas did not need protection under the http://www.nmfs.noaa.gov/pr/laws/esa/ - Endangered Species Act . But this process offers an excellent example of how NOAA’s scientific research informed the decision makers by ensuring that they had best available science was available. http://www.noaa.gov/features/02_monitoring/index.html - http://www.noaa.gov/features/02_monitoring/index.html
------------- "In a time of universal deceit, telling the truth is a revolutionary act." G Orwell |


Posted By: Mahshadin
Date Posted: April 08 2010 at 8:16am
Water Supply ForecastsKey to Successful Water Management
Rocky Mountain snow survey from NOAA aircraft. (Credit: NOAA) People who live in the semi-arid western United States often refer to water as the lifeblood of their land. And there’s a delicate balance between water supply and snow fall. Nearly all water used to supply cities, farms, and industry in the West comes from melting snow in the high mountains. NOAA’s vigilance in monitoring and understanding mountain snow pack helps the agency forecast the availability of water resources for the upcoming year. Managers of this precious resource rely on NOAA forecasts when making decisions about water allocation and management. NOAA leads the National Integrated Drought Information System, which is a collaborative effort between federal, state, and local governments tasked to ensure a high level of drought-related information sharing and awareness. The National Integrated Drought Information System maintains a http://www.drought.gov/ - Web portal where water management officials access current drought status, forecasts, effects and planning information.
Effects of drought. (Credit: NOAA) Managing Water Supplies in DroughtAs shown by the http://www.drought.gov/portal/server.pt/community/drought_indicators/us_drought_monitor - U.S. Drought Monitor , drought occurred in every Western state last year. And drought conditions in the West will continue to be a major concern in the future. Increasing population in Western cities has further stressed water management and has added concern to the already dry region. Before the snow melts each spring, http://www.nws.noaa.gov/ - NOAA’s National Weather Service River Forecast Centers project how much water the melting snow will supply to hundreds of river basins in the western United States. Coordinating with many other agencies, NOAA scientists generate water supply forecasts monthly between December and June for the western United States. Water supply forecasters use mathematical models of the mountain snow pack, water flow, soil infiltration, evaporation, and precipitation to develop forecasts. These models are based on scientific understanding of snow and the land surface coupled with forecasts for weather and climate. Forecasters create detailed water supply forecasts using observations of precipitation, snow totals, temperatures, and stream flow from networks operated by NOAA, the U.S. Geological Survey, the Natural Resources Conservation Service, and state and local agencies. More Effective Resource Management
NOAA Water Supply Forecast Map.(Credit: NOAA) With this combined information, NOAA scientists provide forecasts that are essential for helping water resource managers keep water flowing in homes and communities throughout the western United States. NOAA scientists post seasonal water supply forecasts on their http://www.nwrfc.noaa.gov/westernwater - Water Resource Forecasts Web site. This Web site not only gives residents in the western United States a glimpse of the expected water supply in their area, but it also houses useful information to help water resource managers do their job. http://www.noaa.gov/features/02_monitoring/water_supply.html - http://www.noaa.gov/features/02_monitoring/water_supply.html
Water Supply Forecast Map
http://www.nwrfc.noaa.gov/westernwater/ - http://www.nwrfc.noaa.gov/westernwater/
------------- "In a time of universal deceit, telling the truth is a revolutionary act." G Orwell |


Posted By: Mahshadin
Date Posted: April 08 2010 at 8:33am
The Facts About Snowstorms &
|
 (Credit: NOAA)
 (Credit: NOAA)
 (Credit: NOAA)
 (Credit: NOAA)
Posted By: Mahshadin
Date Posted: April 09 2010 at 7:29pm
Highly efficient vehicles with no polluting emissions Fuel cells were invented in 1839, powered the Gemini and Apollo space missions, and still provide power on the space shuttle. But perfecting them for use in cars still poses a challenge. Scientists at the Laboratory are developing new materials to make fuel cells cost-effective, durable, and vehicle-ready. One day soon, these highly efficient powerhouses could replace internal combustion engines, so that our cars burn less fuel, and give off nothing more than the harmless emission of ordinary water. Decreasing Foreign Oil DependenceThe United States consumes much more oil than we produce domestically. In 2007, the U.S. produced 5.1 million barrels of oil per day, but consumed 20.7 million barrels per day according to the Energy Information Administration, which provides energy statistics from the U.S. government. The result is that the U.S. imports significant amounts of oil, and is dependent upon foreign countries for its oil supply. Fuel cells, which utilize hydrogen instead of gasoline or diesel fuel, would greatly reduce that dependence. Emissions of Pure WaterFuel cells are similar to batteries; they convert chemical energy into electricity. However, unlike batteries, fuel cells use chemicals that are external to the fuel cell. The types of fuel cells LANL scientists develop convert hydrogen and oxygen (from air) into electricity and water. The system utilizes a thin membrane and catalysts – often made of platinum – to electrochemically convert the hydrogen and oxygen into electricity. Superior Fuel EfficiencyOne of the biggest advantages of fuel-cell powered vehicles is their efficiency as compared to conventional internal combustion engines. Replacing an Old StandardBesides the technical challenges the Lab is addressing, fuel cell acceptance may require a sea change in the public’s way of thinking. “Internal combustion engines are very reliable, and performance is good,” Borup says. “With fuel cells, we are trying to put something on the market that displaces existing technologies.” http://www.lanl.gov/discover/fuel_cells_transform_cars - http://www.lanl.gov/discover/fuel_cells_transform_cars
------------- "In a time of universal deceit, telling the truth is a revolutionary act." G Orwell |
Posted By: Mahshadin
Date Posted: April 09 2010 at 8:41pm
|
Interesting news from around our block
-------------------------------------------------------------------
Cassini Doubleheader: Flying By Titan and Dione
Apr. 02, 2010
Cassini Doubleheader: Flying By Titan and Dione In a special double flyby early next week, NASA's Cassini spacecraft will visit Saturn's moons Titan and Dione within a period of about a day and a half, with no maneuvers in between. A fortuitous cosmic alignment allows Cassini to attempt this doubleheader, and the interest in swinging by Dione influenced the design of its extended mission. The Titan flyby, planned for Monday, April 5, will take Cassini to within about 7,500 kilometers (4,700 miles) of the moon's surface. The distance is relatively long as far as encounters go, but it works to the advantage of Cassini's imaging science subsystem. Cassini's cameras will be able to stare at Titan's haze-shrouded surface for a longer time and capture high-resolution pictures of the Belet and Senkyo areas, dark regions around the equator that ripple with sand dunes. In the early morning of Wednesday, April 7 in UTC time zones, which is around 9 p.m. on Tuesday, April 6 in This is only Cassini's second close encounter with Dione. The first flyby in October 2005, and findings from the Voyager spacecraft in the 1990s, hinted that the moon could be sending out a wisp of charged particles into the magnetic field around Saturn and potentially exhaling a diffuse plume that contributes material to one of the planet's rings. Like Enceladus, Saturn's more famous moon with a plume, Dione features bright, fresh fractures. But if there were a plume on Dione, it would certainly be subtler and produce less material. Cassini plans to use its magnetometer and fields and particles instruments to see if it can find evidence of activity at Dione. Thermal mapping by the composite infrared spectrometer will also help in that search. In addition, the visual and infrared mapping spectrometer will examine dark material found on Dione. Scientists would like to understand the source of this dark material. Cassini has made three previous double flybys and another two are planned in the years ahead. The mission is nearing the end of its first extension, known as the Equinox mission. It will begin its second mission extension, known as the Solstice Mission, in October 2010. The Cassini-Huygens mission is a cooperative project of NASA, the European Space Agency and the Italian Space Agency. The Jet Propulsion Laboratory, a division of the California Institute of Technology in ------------- "In a time of universal deceit, telling the truth is a revolutionary act." G Orwell |
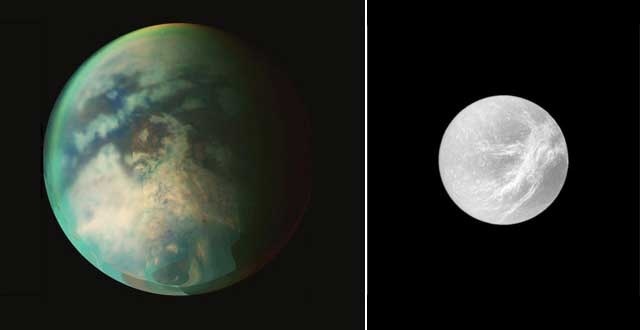
Posted By: Mahshadin
Date Posted: April 10 2010 at 9:11am
|
NASA's Global Hawk Completes First Science Flight Over the Pacific
04.08.10

The Global Hawk can fly autonomously to altitudes above 60,000 feet -- roughly twice as high as a commercial airliner -- and as far as 11,000 nautical miles. Operators pre-program a flight path, and then the plane flies itself for as long as 30 hours. Credit: NASA/Dryden/Carla Thomas
http://www.nasa.gov/images/content/441844main_flightmap.jpg">  On its April 7 flight, the Global Hawk flew approximately 4,500 nautical miles along a flight path that took it to 150.3 degrees West longitude and 54.6 degrees North latitude, just south of Alaska's Kodiak Island. The flight lasted 14.1 hours and flew up to 60,900 feet in altitude. Credit: NASA/Dryden
NASA pilots and flight engineers, together with colleagues from the National Oceanic and Atmospheric Administration (NOAA), have successfully completed the first science flight of the Global Hawk unpiloted aircraft system over the Pacific Ocean. The flight was the first of five scheduled for this month's Global Hawk Pacific (GloPac) mission to study atmospheric science over the Pacific and Arctic oceans.
The Global Hawk is a robotic plane that can fly autonomously to altitudes above 60,000 feet (18.3 kilometers) -- roughly twice as high as a commercial airliner -- and as far as 11,000 nautical miles (20,000 kilometers) -- half the circumference of Earth. Operators pre-program a flight path, and then the plane flies itself for as long as 30 hours, staying in contact through satellite and line-of-site communications to the ground control station at NASA's Dryden Flight Research Center in California's Mojave Desert. "The Global Hawk is a revolutionary aircraft for science because of its enormous range and endurance," said Paul Newman, co-mission scientist for GloPac and an atmospheric scientist from NASA's Goddard Space Flight Center, Greenbelt, Md. "No other science platform provides this much range and time to sample rapidly evolving atmospheric phenomena. This mission is our first opportunity to demonstrate the unique capabilities of this plane, while gathering atmospheric data in a region that is poorly sampled." GloPac researchers will directly measure and sample greenhouse gases, ozone-depleting substances, aerosols, and constituents of air quality in the upper troposphere and lower stratosphere. In yesterday's flight, the plane flew approximately 4,500 nautical miles (8,300 kilometers) along a flight path that took it from Dryden to 150.3 degrees West longitude and 54.6 degrees North latitude, just south of Alaska's Kodiak Island. The flight lasted 14.1 hours and flew up to 60,900 feet (18.6 kilometers) in altitude. Reaching Higher into the Atmosphere and Staying There "The Global Hawk is a fantastic platform because it gives us expanded access to the atmosphere beyond what we have with piloted aircraft," said David Fahey, co-mission scientist and a research physicist at NOAA's Earth System Research Laboratory in Boulder, Colo. "We can go to regions we couldn't reach or go to previously explored regions and study them for extended periods that are impossible with conventional planes." The plane carries 11 instruments to sample the chemical composition of Earth�s two lowest atmospheric layers, to profile the dynamics and meteorology of both, and to observe the distribution of clouds and aerosol particles. Project scientists expect to take observations from the equator to the Arctic Circle, and west of Hawaii. (Select Pic for more information) http://www.nasa.gov/externalflash/Glopac/">  The Global Hawk carries 11 instruments to sample the chemical composition of Earth�s two lowest atmospheric layers, to profile the dynamics and meteorology of both, and to observe the distribution of clouds and aerosol particles. View this interactive feature to learn more about each of the aircraft's instruments. Credit: NASA/Scott Hanger The Global Hawk carries 11 instruments to sample the chemical composition of Earth�s two lowest atmospheric layers, to profile the dynamics and meteorology of both, and to observe the distribution of clouds and aerosol particles. View this interactive feature to learn more about each of the aircraft's instruments. Credit: NASA/Scott HangerThe timing of GloPac flights should allow scientists to observe the breakup of the polar vortex, a large-scale cyclone that dominates winter weather patterns around the Arctic and is particularly important for understanding ozone depletion in the Northern Hemisphere. Researchers appear to have gathered some measurements from the polar vortex during yesterday's flight. Scientists also expect to gather data between 45,000 and 65,000 feet, where many greenhouse gases and ozone-depleting substances are destroyed. They will measure dust, smoke and pollution that cross the Pacific from Asia and Siberia and affect U.S. air quality. Several instruments will measure aerosols, which play an important but incompletely understood role in Earth's radiation budget. Some aerosols absorb warming sunlight, while others reflect it back to space and cool the planet. High-altitude particles can serve as nuclei for the formation of clouds. Command and Control http://www.nasa.gov/images/content/441849main_glopaccontrol.jpg">  The Global Hawk Operations Center (GHOC) at NASA's Dryden Flight Research Center serves as the cockpit of the Global Hawk. The pilots, who monitor and control the aircraft from the GHOC, have displays of all aircraft parameters and can override the autonomous flight control system to make course corrections and altitude adjustments. Credit: NASA/Dryden/Tony Landis The Global Hawk Operations Center (GHOC) at NASA's Dryden Flight Research Center serves as the cockpit of the Global Hawk. The pilots, who monitor and control the aircraft from the GHOC, have displays of all aircraft parameters and can override the autonomous flight control system to make course corrections and altitude adjustments. Credit: NASA/Dryden/Tony LandisThe Global Hawk Operations Center (GHOC) at Dryden serves as the cockpit of the Global Hawk, where ground-based flight computers and communications equipment play integral parts in the system. Pilots design the flight path and then upload the route into the aircraft�s computer.
The aircraft can then take off, fly its mission, and land without any additional pilot or scientist intervention. Though the plane is designed to fly on its own, pilots can change course or altitude based on the atmospheric phenomena ahead. Researchers also have the ability to command and control their instruments from the ground. GloPac will make several flights directly under the path of NASA�s Aura satellite and other "A-train� Earth-observing satellites, "allowing us to calibrate and confirm what we see from space," Newman said. GloPac is being conducted in conjunction with NASA�s Aura Validation Experiment (AVE). During the first science flight, the Global Hawk flew under the Cloud-Aerosol LIDAR and Infrared Pathfinder Satellite Observation (CALIPSO), a joint project of NASA and France's Centre National d'Etudes Spatiales. Built by Northrop Grumman Corp., Rancho Bernardo, Calif., NASA's Global Hawk aircraft were originally flown in the Advanced Concept Technology Demonstration program sponsored by the Defense Advanced Research Projects Agency. Two test models were transferred from the U.S. Air Force to NASA in 2007, and a third was transferred in 2009. Northrop Grumman and NASA Dryden signed a Space Act Agreement to re-fit and maintain three Global Hawks for use in high-altitude, long-duration Earth science missions. The GloPac mission includes more than 130 researchers and technicians from Goddard; NASA�s Jet Propulsion Laboratory, Pasadena, Calif.; NASA�s Ames Research Center, Moffett Field, Calif.; and Dryden, as well as NOAA's Earth System Research Laboratory; Northrup Grumman; the University of California, Santa Cruz; Droplet Measurement Technologies of Boulder, Colo.; and the University of Denver. http://www.nasa.gov/topics/earth/features/global-hawk.html - http://www.nasa.gov/topics/earth/features/global-hawk.html
______________________________________________________________________
GLOPAC Mission
The flights are designed to address various science objectives: 1. validation and scientific collaboration with NASA earth-monitoring satellite missions, principally the Aura satellite, 2. observations of stratospheric trace gases in the upper troposphere and lower stratosphere from the mid-latitudes into the tropics, 3. sampling of polar stratospheric air and the break-up fragments of the air that move into the mid-latitudes, 4. measurements of dust, smoke, and pollution that cross the Pacific from Asia and Siberia, 5. measurements of streamers of moist air from the central tropical Pacific that move onto the West Coast of the United States (atmospheric rivers). http://www.espo.nasa.gov/glopac/ - http://www.espo.nasa.gov/glopac/
http://www.nasa.gov/externalflash/Glopac/ - http://www.nasa.gov/externalflash/Glopac/
------------- "In a time of universal deceit, telling the truth is a revolutionary act." G Orwell |
Posted By: Mahshadin
Date Posted: April 10 2010 at 6:37pm
|
NASA Demonstrates Ocean-Powered Underwater Vehicle
04.05.10

The SOLO-TREC autonomous underwater vehicle is deployed off the coast of Hawaii on an ocean endurance test, Nov. 30, 2009. Image credit: NASA/JPL/U.S. Navy/Scripps Institution of Oceanography
PASADENA, Calif. � NASA, U.S. Navy and university researchers have successfully demonstrated the first robotic underwater vehicle to be powered entirely by natural, renewable, ocean thermal energy. The Sounding Oceanographic Lagrangrian Observer Thermal RECharging (SOLO-TREC) autonomous underwater vehicle uses a novel thermal recharging engine powered by the natural temperature differences found at different ocean depths. Scalable for use on most robotic oceanographic vehicles, this technology breakthrough could usher in a new generation of autonomous underwater vehicles capable of virtually indefinite ocean monitoring for climate and marine animal studies, exploration and surveillance. Researchers at NASA's Jet Propulsion Laboratory, Pasadena, Calif.; and the Scripps Institution of Oceanography, University of California, San Diego, completed the first three months of an ocean endurance test of the prototype vehicle off the coast of Hawaii in March. "People have long dreamed of a machine that produces more energy than it consumes and runs indefinitely," said Jack Jones, a JPL principal engineer and SOLO-TREC co-principal investigator. "While not a true perpetual motion machine, since we actually consume some environmental energy, the prototype system demonstrated by JPL and its partners can continuously monitor the ocean without a limit on its lifetime imposed by energy supply." "Most of Earth is covered by ocean, yet we know less about the ocean than we do about the surface of some planets," said Yi Chao, a JPL principal scientist and SOLO-TREC principal investigator. "This technology to harvest energy from the ocean will have huge implications for how we can measure and monitor the ocean and its influence on climate." 
Plot map of the path of the SOLO-TREC autonomous underwater vehicle since its deployment south of Hawaii on Nov. 30, 2009. Image credit:NASA/JPL/SIO/NOAA/U.S. Navy/NGA/GEBCO/Google
SOLO-TREC draws upon the ocean's thermal energy as it alternately encounters warm surface water and colder conditions at depth. Key to its operation are the carefully selected waxy substances known as phase-change materials that are contained in 10 external tubes, which house enough material to allow net power generation. As the float surfaces and encounters warm temperatures, the material melts and expands; when it dives and enters cooler waters, the material solidifies and contracts. The expansion of the wax pressurizes oil stored inside the float. This oil periodically drives a hydraulic motor that generates electricity and recharges the vehicle's batteries. Energy from the rechargeable batteries powers the float's hydraulic system, which changes the float's volume (and hence buoyancy), allowing it to move vertically. So far, SOLO-TREC has completed more than 300 dives from the ocean surface to a depth of 500 meters (1,640 feet). Its thermal recharging engine produced about 1.7 watt-hours, or 6,100 joules, of energy per dive, enough electricity to operate the vehicle's science instruments, GPS receiver, communications device and buoyancy-control pump. The SOLO-TREC demonstration culminates five years of research and technology development by JPL and Scripps and is funded by the Office of Naval Research. JPL developed the thermal recharging engine, building on the buoyancy engine developed for the Slocum glider by Teledyne Webb Research, Falmouth, Mass. Scripps redesigned the SOLO profiling float and performed the integration. The 84-kilogram (183-pound) SOLO-TREC prototype was tested and deployed by the JPL/Scripps team on Nov. 30, 2009, about 161 kilometers (100 miles) southwest of Honolulu. The performance of underwater robotic vehicles has traditionally been limited by power considerations. "Energy harvesting from the natural environment opens the door for a tremendous expansion in the use of autonomous systems for naval and civilian applications," said Thomas Swean, the Office of Naval Research program manager for SOLO-TREC. "This is particularly true for systems that spend most of their time submerged below the sea surface, where mechanisms for converting energy are not as readily available. The JPL/Scripps concept is unique in that its stored energy gets renewed naturally as the platform traverses ocean thermal gradients, so, in theory, the system has unlimited range and endurance. This is a very significant advance." SOLO-TREC is now in an extended mission. The JPL/Scripps team plans to operate SOLO-TREC for many more months, if not years. "The present thermal engine shows the great promise in harvesting ocean thermal energy," said Russ Davis, a Scripps oceanographer. "With further engineering refinement, SOLO-TREC has the potential to augment ocean monitoring currently done by the 3,200 battery-powered Argo floats." The international Argo array, supported in part by the National Oceanic and Atmospheric Administration, measures temperature, salinity and velocity across the world's ocean. NASA and the U.S. Navy also plan to apply this thermal recharging technology to the next generation of submersible vehicles. http://www.nasa.gov/topics/earth/features/earth20100405.html - http://www.nasa.gov/topics/earth/features/earth20100405.html
------------- "In a time of universal deceit, telling the truth is a revolutionary act." G Orwell |
Posted By: Mahshadin
Date Posted: April 11 2010 at 9:20am
|
NASA Sensors Providing Rapid Estimates of Iceland Volcano Emissions
04.07.10
 False-color short-wavelength infrared image of Iceland's Eyjafjallajokull volcano from data obtained by NASA's EO-1 Hyperion satellite on March 24, 2010. image credit: NASA/JPL/EO-1 Mission/GSFC/Ashley Davies False-color short-wavelength infrared image of Iceland's Eyjafjallajokull volcano from data obtained by NASA's EO-1 Hyperion satellite on March 24, 2010. image credit: NASA/JPL/EO-1 Mission/GSFC/Ashley Davies A NASA research team is using the latest advances in satellite artificial intelligence to speed up estimates of the heat and volume of lava escaping from an erupting volcano in Iceland. On March 20, 2010, Iceland's Eyjafjallajökull volcano (pronounced "AYA-feeyapla-yurkul,") awakened for the first time in 120 years, spewing still-active lava fountains and flows. That day, a NASA "sensor web" -- a network of sensors on the ground and aboard NASA's Earth Observing-1 satellite, alerted researchers to this new volcanic "hot spot." The eruption was detected by autonomous "sciencecraft" software aboard the satellite, which is known as EO-1. Sciencecraft software enables the spacecraft to analyze science data onboard to detect scientific events and respond by sending alerts, producing scientific products and/or re-imaging the event. The software is typically able to notify researchers on the ground within 90 minutes of detecting events, and then rapidly sets up the satellite to observe them. In the case of the Iceland volcanic event, EO-1 was able to take advantage of recently uploaded "smart" software that allows the spacecraft to react quickly to an event and to rapidly downlink the data for processing by ground personnel in less than 24 hours. That process used to take three weeks for researchers working manually. The artificial intelligence software directed EO-1's Hyperion and Advanced Land Imager instruments to target the volcano on its next passes over Iceland, which occurred on March 24, 29 and 30. After image data were transmitted to a ground station at NASA's Jet Propulsion Laboratory in Pasadena, Calif., computers automatically analyzed them and created maps and estimates of heat loss and eruption flow rate. "Use of autonomous systems in this way represents a new way of doing science, where spacecraft can think for themselves and react to dynamic and often transient events," explained Ashley Davies, lead scientist for NASA's New Millennium Program-Space Technology 6 Autonomous Sciencecraft Experiment at JPL. "This autonomy technology enables spacecraft to rapidly inform the ground of significant events, like the volcanic eruption," said Steve Chien, principal investigator for the Autonomous Sciencecraft at JPL. "This same technology has been used to track fires, flooding and other natural hazards." "This sensorweb technology enables rapid retasking of the EO-1 spacecraft, making it easier to track breaking phenomena such as the Iceland volcano," added Daniel Mandl, EO-1 spacecraft mission manager at NASA's Goddard Space Flight Center, Greenbelt, Md. Goddard manages the EO-1 mission for NASA's Science Mission Directorate, Washington. Less than 24 hours after the satellite's first observation, the JPL team confirmed the volcano was emitting more than one billion watts of energy -- enough to power 40,000 passenger cars at the same time -- and discharging more than six tons of lava per second. The fully automated process accelerated NASA's distribution of images to volcanologists studying the eruption. Rapid calculations of lava volume (known as the effusion rate) and location can help determine the likely direction of lava flows, while giving emergency managers advance warning to plan and deploy resources, and carry out informed evacuations. Davies believes he and other researchers can use the "onboard autonomy" to achieve a greater and faster return rate of new Earth and planetary science data, while offering potentially life-saving benefits through rapid detection of natural events. "There is concern that this eruption might precede another larger eruption at the Katla volcano nearby," said Davies. "If it does, we will be poised to provide imaging data of activity as the eruption evolves." http://www.nasa.gov/topics/earth/features/volcano20100407.html - http://www.nasa.gov/topics/earth/features/volcano20100407.html
------------- "In a time of universal deceit, telling the truth is a revolutionary act." G Orwell |
Posted By: Mahshadin
Date Posted: April 11 2010 at 10:25am
|
Solar 'Conveyor Belt' Runs at Record-High Speeds
03.12.10  Diagram of the distribution of the sun's magnetic field over three 11-year solar cycles. Yellow represents magnetic field directed out of the sun. Blue represents magnetic field into the sun. Sunspots themselves produce the "Butterfly" pattern at low latitudes. The sun's meridional flow from the equator to the poles in each hemisphere carries magnetic remains of the sunspots to the poles. This produces the streaks seen at higher latitudes and reverses the magnetic polarity of the sun's poles every 11 years. Image credit: NASA/MSFC/David Hathaway
 Solar physicist David Hathaway of NASA's Marshall Space flight Center in Huntsville, AL and graduate student Lisa Rightmire of the University of Memphis in Tennessee have been monitoring the sun using the Solar and Heliospheric Observatory (SOHO). They observe a massive circulating current of fire (hot plasma) within the sun operating at a faster pace as reported in the March 12th issue of Science.
The current of fire is a conveyor belt-like system called the Meridional Flow which rises to the surface at the sun's equator and spreads out toward the poles where it sinks back into the sun. "Normally it reaches peak speeds of about 20 mph," says Hathaway. "However, in 2004 the speed increased to nearly 30 mph and has remained that fast since." The faster pace is a revelation because it occurred during the deepest solar minimum in almost 100 years and indications that the next solar cycle will be a weak one. This contradicts some theories that say a fast pace results in increased sunspot production. But it agrees with others that say a fast pace results in decreased sunspot production. The faster rate of currents on the sun and the expected weaker solar cycle have affects for those of us here on Earth. One affect is the temperature increase of the Earth could slow down, there would be fewer auroras, and to the extent that we depend on satellites, GPS, and cell phones there should be less disruption in service. http://www.nasa.gov/topics/solarsystem/features/solar_plasma.html - http://www.nasa.gov/topics/solarsystem/features/solar_plasma.html
More information
http://science.nasa.gov/science-news/science-at-nasa/2010/12mar_conveyorbelt/ - http://science.nasa.gov/science-news/science-at-nasa/2010/12mar_conveyorbelt/
------------- "In a time of universal deceit, telling the truth is a revolutionary act." G Orwell |
Posted By: Mahshadin
Date Posted: April 13 2010 at 9:42pm
|
Innovative NASA-JAXA Partnership Benefits Global Earth Science
This new partnership between NASA and the Japan Aerospace Exploration Agency, known as JAXA, uses NASA's Tracking and Data Relay Satellite System to download observations over North and South America taken by instruments on JAXA's Advanced Land Observing Satellite, or ALOS. By combining NASA and JAXA data-relay satellite resources, coverage of North and South America nearly doubles. Observations will be made about twice as often. "This is a great example of the value to be gained through international collaboration between the world's Earth-observing nations," said Michael Freilich, director of the Earth Science Division in the Science Mission Directorate at NASA Headquarters in Washington. "By working together and sharing satellite resources like this, we can produce more data more rapidly and cost-effectively than if each of us went it alone." The Phased Array type L-band synthetic aperture radar, known as PALSAR, is one of the instruments aboard ALOS. It precisely measures the distance to Earth's surface under all weather conditions during day and night. Measurements from this instrument are used for detecting changes in the ground surface associated with earthquakes, volcanic eruptions, and landslides; mapping forest cover and flooding in the tropics that affect the carbon balance in land-based ecosystems; and determining the speed at which ice sheets and glaciers move, which contributes to sea-level rise. NASA does not currently have this type of instrument in orbit, but a NASA synthetic aperture radar mission is planned to launch later this decade. NASA has been obtaining these data from JAXA and other international space agencies for use by U.S. scientists. Under the new agreement with JAXA, NASA will have access to all the ALOS data acquired over the Americas and can make it available to scientists affiliated with U.S. government agencies for peaceful scientific purposes. The Alaska Satellite Facility, a NASA data center located at the University of Alaska Fairbanks, will process and distribute the PALSAR data. "The expanded ALOS data flow will significantly improve our scientists' ability to monitor regions at risk to earthquake hazards, such as Haiti and Chile," said Craig Dobson, natural hazards program manager in the Earth Science Division at NASA Headquarters. "Now we will be able to see very small changes in surface elevation associated with the build-up and release of strain in seismic zones over virtually the entire area of the Americas, with measurements made as often as every 46 days. Scientists also will be able to monitor seasonal changes in groundwater resources." NASA's Tracking and Data Relay Satellite System consists of eight communication satellites stationed in geosynchronous orbits. With ground stations at the White Sands Complex near Las Cruces, N.M., and at Guam, the system can provide complete coverage of user spacecraft. The system supports communications with the International Space Station, the Hubble Space Telescope, and many other NASA missions. ALOS data began to be distributed to users by the Alaska Satellite Facility today under the new agreement. The partnership is the result of development and testing work accomplished by a joint NASA-JAXA team that was started three years ago. This new NASA-JAXA agreement continues a long and productive partnership between the nations in satellite observation of Earth. Japanese instruments are flying on NASA's Terra and Aqua satellites, and NASA sensors have flown on previous Japanese Earth-observation missions. The NASA-JAXA Global Precipitation Mission, to be launched in 2013, will include both NASA- and JAXA-supplied sensors on a NASA satellite launched on a JAXA rocket. The mission will provide the first frequent, accurate measurements of rainfall over the entire globe for use by scientists and weather forecasters http://www.nasa.gov/home/hqnews/2010/apr/HQ_10-079_NASA-JAXA.html - http://www.nasa.gov/home/hqnews/2010/apr/HQ_10-079_NASA-JAXA.html
------------- "In a time of universal deceit, telling the truth is a revolutionary act." G Orwell |
Posted By: Mahshadin
Date Posted: April 14 2010 at 7:25pm
|
Flash: NASA's Cassini Sees Lightning on Saturn
04.14.10

NASA's Cassini spacecraft captured the first lightning flashes on Saturn when it captured these images on August 17, 2009. Credit: NASA/JPL-Caltech/SSI
 This Cassini movie -- the first of its kind -- shows lightning on Saturn's night side flashing in a cloud that is illuminated by light from Saturn's rings. Credit: NASA/JPL-Caltech/SSI/University of Iowa
PASADENA, Calif. � NASA's Cassini spacecraft has captured images of lightning on Saturn. The images have allowed scientists to create the first movie showing lightning flashing on another planet. After waiting years for Saturn to dim enough for the spacecraft's cameras to detect bursts of light, scientists were able to create the movie, complete with a soundtrack that features the crackle of radio waves emitted when lightning bolts struck. "This is the first time we have the visible lightning flash together with the radio data," said Georg Fischer, a radio and plasma wave science team associate based at the Space Research Institute in Graz, Austria. "Now that the radio and visible light data line up, we know for sure we are seeing powerful lightning storms." The movie and radio data suggest extremely powerful storms with lightning that flashes as brightly as the brightest super-bolts on Earth, according to Andrew Ingersoll, a Cassini imaging science subsystem team member at the California Institute of Technology in Pasadena. "What's interesting is that the storms are as powerful -- or even more powerful -- at Saturn as on Earth," said Ingersoll. "But they occur much less frequently, with usually only one happening on the planet at any given time, though it can last for months." The first images of the lightning were captured in August 2009, during a storm that churned from January to October 2009 and lasted longer than any other observed lightning storm in the solar system. Results are described in an article accepted for publication in the journal Geophysical Research Letters. To make a video, scientists needed more pictures with brighter lightning and strong radio signals. Data were collected during a shorter subsequent storm, which occurred from November through mid-December 2009. The frames in the video were obtained over 16 minutes on Nov. 30, 2009. The flashes lasted less than one second. The images show a cloud as long as 3,000 kilometers (1,900 miles) across and regions illuminated by lightning flashes about 300 kilometers (190 miles) in diameter. Scientists use the width of the flashes to gauge the depth of the lightning below the cloud tops. When lightning strikes on Earth and on Saturn, it emits radio waves at a frequency that can cause static on an AM radio. The sounds in the video approximate that static sound, based on Saturn electrostatic discharge signals detected by Cassini's radio and plasma wave science instrument. Cassini, launched in 1997, and NASA's Voyager mission, launched in 1977, had previously captured radio emissions from storms on Saturn. A belt around the planet where Cassini has detected radio emissions and bright, convective clouds earned the nickname "storm alley." Cassini's cameras, however, had been unable to get pictures of lightning flashing. Since Cassini's arrival at Saturn in 2004, it has been difficult to see the lightning because the planet is very bright and reflective. Sunlight shining off Saturn's enormous rings made even the night side of Saturn brighter than a full-moon night on Earth. Equinox, the period around August 2009 when the sun shone directly over the planet's equator, finally brought the needed darkness. During equinox, the sun lit the rings edge-on only and left the bulk of the rings in shadow. Seeing lightning was another highlight of the equinox period, which already enabled scientists to see clumps in the rings as high as the Rocky Mountains. "The visible-light images tell us a lot about the lightning," said Ulyana Dyudina, a Cassini imaging team associate based at Caltech, who was the first to see the flashes. "Now we can begin to measure how powerful these storms are, where they form in the cloud layer and how the optical intensity relates to the total energy of the thunderstorms." http://www.nasa.gov/mission_pages/cassini/media/cassini20100414.html - http://www.nasa.gov/mission_pages/cassini/media/cassini20100414.html
Short video with static audio
http://www.ciclops.org/view_media/30660/Lightning_Flashing_on_Saturn - http://www.ciclops.org/view_media/30660/Lightning_Flashing_on_Saturn ------------- "In a time of universal deceit, telling the truth is a revolutionary act." G Orwell |
Posted By: Mahshadin
Date Posted: April 14 2010 at 7:58pm
|
For Fun Golf
a little out of the way but the scenery is worth it.
(Think I will need a mulligan or 2)
http://www.ciclops.org/view_media.php?path=games/golf_sector6/golf_sector6.swf&width=1000&height=800&title=GOLF - http://www.ciclops.org/view_media.php?path=games/golf_sector6/golf_sector6.swf&width=1000&height=800&title=GOLF
------------- "In a time of universal deceit, telling the truth is a revolutionary act." G Orwell |
Posted By: Mahshadin
Date Posted: April 16 2010 at 9:49am
http://peruanista.blogspot.com/2010/04/glacier-in-peru-melts-down-and-break.html - Glacier in Peru Melts Down and Break Off into a Lake Causing Tsunami and Mudslides in Central Andes [PHOTOS & VIDEO]A glacier broke off in the central Peruvian Andes and fell into a lake causing what scientists said was a 75-foot tsunami, killing three people, causing mudslides and the destruction of a water processing reservoir used to supply the surrounding towns. http://lh6.ggpht.com/_tLOnL2biaWE/S8V4Zkyis9I/AAAAAAAADv0/Acf8j09x1m4/s720/Huancan%20Glacier%20Map.jpg">
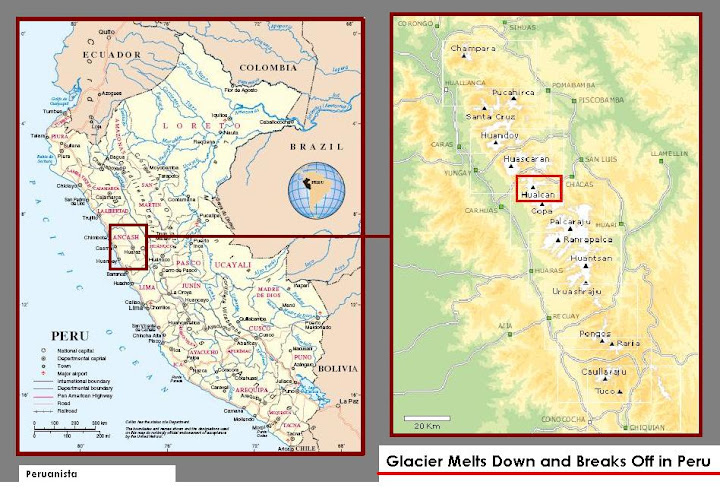 Map by Peruanista. Source: andix.com and allthemountains.com Map by Peruanista. Source: andix.com and allthemountains.comFull Article
http://peruanista.blogspot.com/2010/04/glacier-in-peru-melts-down-and-break.html - http://peruanista.blogspot.com/2010/04/glacier-in-peru-melts-down-and-break.html
------------- "In a time of universal deceit, telling the truth is a revolutionary act." G Orwell |
Posted By: Turboguy
Date Posted: April 16 2010 at 10:30am
Heh, I nailed one and almost got a stable orbit around Helene. It went around six times before it degraded and came back down. ------------- Liberals claim to want to give a hearing to other views, but then are shocked and offended to discover that there are other views. - William F. Buckley |
Posted By: Mahshadin
Date Posted: April 16 2010 at 2:33pm
http://sohowww.nascom.nasa.gov//data/REPROCESSING/Completed/2010/eit304/20100413/20100413_1319_eit304_1024.jpg">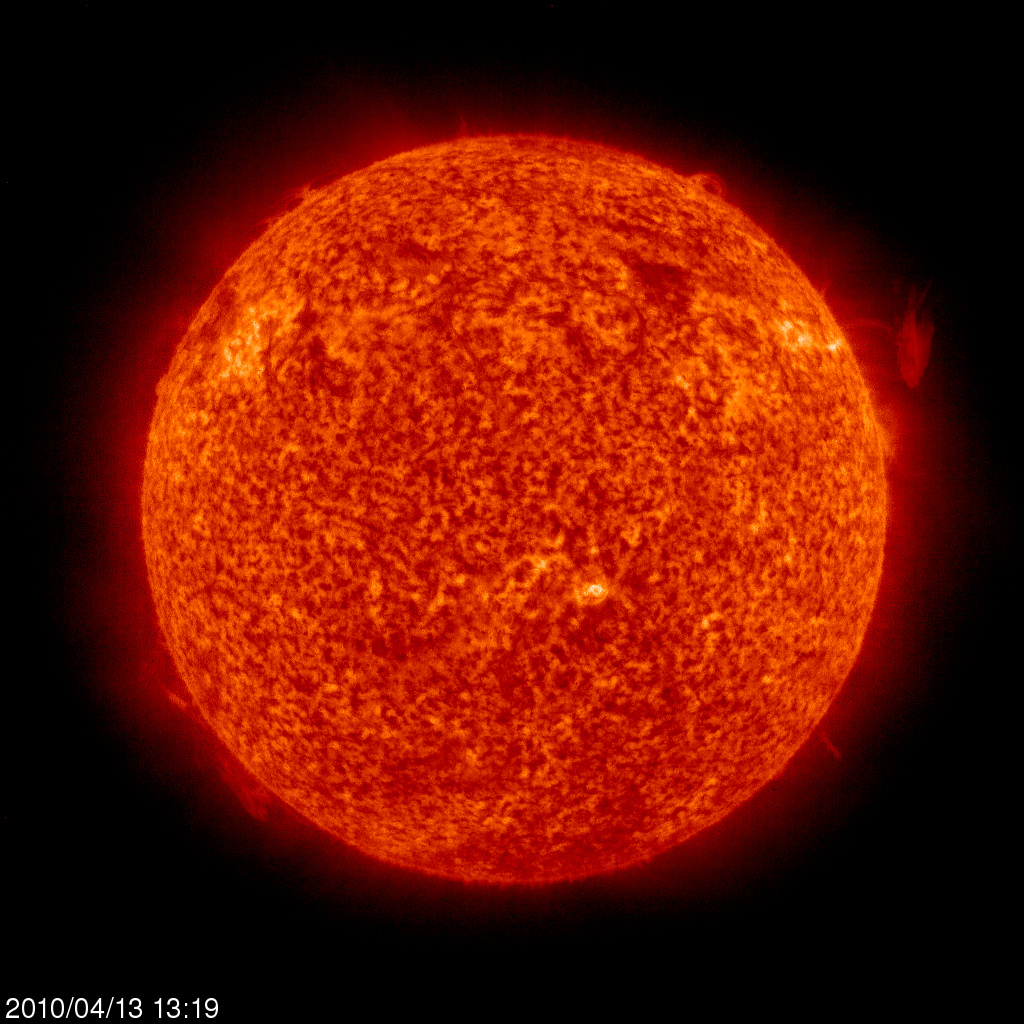 ------------- "In a time of universal deceit, telling the truth is a revolutionary act." G Orwell |