| PANDEMIC ALERT LEVEL |
| 123456 |
| Tracking the next pandemic: Avian Flu Talk |
Exponential Growth - Stop and Read Immediately |
Post Reply 
|
Page <1 34567 19> |
| Author | |
roni3470 
Adviser Group 

Joined: August 30 2006 Location: Colorado Status: Offline Points: 5390 |
 Post Options Post Options
") Thanks(0) Thanks(0)
 Quote Reply Quote Reply
 Posted: February 10 2020 at 6:15am Posted: February 10 2020 at 6:15am |
|
I also don't disagree that the stats are worse than we think but I am super encouraged that there are not more cases in the US and other countries. If it were as bad as some of us had envisioned in our heads, it would be everywhere and more deaths outside of China by now. So even though the slow down gives us all caution if it is true, I think there are other things pointing to this not being as dangerous. Prep on!!
|
|
|
NOW is the Season to Know
that Everything you Do is Sacred |
|
 |
|
|
ZedNorte
Valued Member 
Joined: February 05 2020 Location: Oregon Status: Offline Points: 80 |
Post Options
Thanks(0)
Quote Reply
Posted: February 10 2020 at 7:02am |
|
The biggest issue I see though, is the long period (up to 14 days) from infection to symptoms. Owing to this, I’m not so sure we can relax. By the end of February, I think we’ll have a much better grasp on the trajectory of this thing.
|
|
|
|
|
Newbie1A
Adviser Group

Joined: January 26 2018 Location: Alberta Status: Offline Points: 11180 |
Post Options
Thanks(0)
Quote Reply
Posted: February 10 2020 at 7:34am |
I just snorted my tea out my nose! Just too true...and too funny! Thank you for a great chuckle for a long day coming up! |
|
|
If it's to be - it's up to me!
|
|
|
|
|
BabyCat
V.I.P. Member
Joined: January 26 2020 Status: Offline Points: 15175 |
Post Options
Thanks(0)
Quote Reply
Posted: February 10 2020 at 9:12pm |
|
Read a long article of an interview of a Wuhan doctor on the front lines, says average is about 3 weeks to die, from confirmation/hospital admission to death.
Week 1, usually mild. Week 2, some (20-25%) get serious, if don't get help right away, death, crapshoot of whether they live or die. Week 3, either better, or dead. Here's a new chart from Twitter, explaining how China lies. China's data neatly fits the quadratic x2=1 . It just doesn't happen so predictably in real life. Watch the different in international infections rates going forward. --- Polar Bear Diaries @DiariesPolar "All epidemics – before they are brought under control – take the form of a green line, an exponential function of some sort. It is impossible for them to take the form of a blue line, a quadratic formula of some sort" #ChinaLies #ChinaVirus #Coronavirus #CoronavirusOutbreak https://mobile.twitter.com/DiariesPolar/status/1227055621100298240 
|
|
|
|
|
FluMom
Adviser Group
Valued Member Since 2006 Joined: February 03 2020 Location: Colorado Status: Offline Points: 14695 |
Post Options
Thanks(0)
Quote Reply
Posted: February 10 2020 at 9:20pm |
|
LOL BabyCat your graphs mean nothing to an old woman who was never good with math! Can you give a short explanation of what your graphs mean when you post them. If not don’t worry I think they are real pretty you are just really smart and I am really dumb with graphs.
|
|
|
|
|
BabyCat
V.I.P. Member
Joined: January 26 2020 Status: Offline Points: 15175 |
Post Options
Thanks(0)
Quote Reply
Posted: February 11 2020 at 4:23pm |
|
A few days ago (7th), posted this:
"International cases rising 18% day. I did a quick breakdown projection, where we might be in 30, 60, 90 days at that rate. Day 1 326 (today) 2 385 3 454 4 536 5 632 6 746 7 880" -- Today (11th, Day 4 of prediction) at 517 at this moment. Predicted 536. 18% still a bit too high. Probably around 15% increase every day, I hope it stays in this sub-exponential (somewhat linear) form. (However, epidemics typically begin in exponential until a certain point) Do the math from there. Even if stays sub-exponential, may get ugly, real soon. Maybe the rest of world dodges a bullet when Spring comes. Time will tell. Today 517 2 595 3 684 4 786 5 904 6 1040 7 1,196 8 1,375 9 1,582 10 1,819 11 2,092 12 2,405 13 2,766 14 3,182 15 3,658 16 4,207 17 4,838 18 5,564 19 6,498 20 7,358 21 8,461 A caveat, too, is that most of the new international infections are from the Japan cruise liner. However, I believe the high infection confirmations are because of confirmed exposure followed by aggressive testing. Other countries are not as aggressively testing such a defined sample set. In other words, they're not looking hard enough. Thus, significant undercounting or underreporting at the moment. The lull in the international storm. But, it's coming, I am convinced, and will unleash hell. Best to be prepared to battle now. On the 8th, I also used a graph to predict 1000 cases in 8 days (by the 16th). Over halfway there. (517). 5 more days to go. We'll see if it gets there, and which model wins out. I hope both models are incorrect. I really, really, really, really hope not. For the world's sake. But the epidemiology and the math are cold, hard facts we must accept. Right now, the rest of the world, except of China, HK, maybe Singapore, and a few other places are not battening down the hatches. I think they should. I think FAR more aggressive contact tracing and testing needs to happen NOW with all those who have had an international travel history from Wuhan or Hubei province recently (estimates about 60,000). and their close contacts. I think we'd find a lot more. I think it's a worldwide imperative. 
|
|
|
|
|
BabyCat
V.I.P. Member
Joined: January 26 2020 Status: Offline Points: 15175 |
Post Options
Thanks(0)
Quote Reply
Posted: February 11 2020 at 4:30pm |
|
|
|
|
|
BabyCat
V.I.P. Member
Joined: January 26 2020 Status: Offline Points: 15175 |
Post Options
Thanks(0)
Quote Reply
Posted: February 11 2020 at 4:47pm |
|
Flumom, sorry I didn't see your post.
The graphs mean that it could get bad, soon, or not so bad, and take longer. I really don't know which. I think the world's health authorities are working very hard. I think it's clear it's not going to be stopped anytime soon. I think it could be delayed for a few more months, and if we get lucky, we dodge a bullet and can be aggressive and limit its spread to just localized breakouts. It COULD sweep the globe by the end of the year, just like many experts are predicting IF things go bad and international containment efforts fail in the short term. |
|
|
|
|
BabyCat
V.I.P. Member
Joined: January 26 2020 Status: Offline Points: 15175 |
Post Options
Thanks(0)
Quote Reply
Posted: February 11 2020 at 4:49pm |
|
Also, my first post, the direst charts, have not happened. Relieved.
|
|
|
|
|
BabyCat
V.I.P. Member
Joined: January 26 2020 Status: Offline Points: 15175 |
Post Options
Thanks(1)
Quote Reply
Posted: February 11 2020 at 5:06pm |
|
I also won't post charts and graphs based on Chinese data as often, as I feel it's not reliable. The CDC says they are definitely "undercounted" (but I hear the word "manipulated")
I'll begin to focus more on international numbers, as they are more reliable, and at least are what they purport to be. I'm not trusting any numbers out of China.   
|
|
|
|
|
Newbie1A
Adviser Group
Joined: January 26 2018 Location: Alberta Status: Offline Points: 11180 |
Post Options
Thanks(0)
Quote Reply
Posted: February 11 2020 at 5:26pm |
|
Thanks for all the work on these graphs BabyCat - much appreciated!
|
|
|
If it's to be - it's up to me!
|
|
|
|
|
pheasant
Admin Group

Joined: May 20 2006 Location: Florida Status: Offline Points: 9851 |
Post Options
Thanks(0)
Quote Reply
Posted: February 11 2020 at 5:51pm |
|
Ditto<<<<
|
|
|
The only thing we have to fear, is fear itself......FDR
|
|
|
|
|
Technophobe
Assistant Admin

Joined: January 16 2014 Location: Scotland Status: Offline Points: 88450 |
Post Options
Thanks(0)
Quote Reply
Posted: February 12 2020 at 3:37am |
|
Ditto, ditto!
|
|
|
How do you tell if a politician is lying?
His lips or pen are moving. |
|
|
|
|
EdwinSm,
Moderator
Joined: April 03 2013 Status: Offline Points: 24065 |
Post Options
Thanks(0)
Quote Reply
Posted: February 12 2020 at 3:57am |
|
Thanks for all your work Baby Cat.
 I think you are wise to switch your focus more to the "rest of the world". However, I was wondering if at this stage at least you should just exclude mainland China, as both Hong Kong and Taiwan/Taipei seem to be providing more acceptable statistics. [I know too little to be able to judge Macau's data]. I know the above is not politically correct (ie WHO lumps all four units into one line in their status reports), but it might give better data. |
|
|
|
|
WitchMisspelled
Adviser Group
Joined: January 20 2020 Status: Offline Points: 17170 |
Post Options
Thanks(0)
Quote Reply
Posted: February 12 2020 at 5:08am |
|
You're the best Baby Cat. I might not always understand what you lay out there, but I recognize you're doing this for all of us.
EdwinSm has a point. Because we know China is not releasing (or even know) the actual numbers, It might be a useful exercise to do those countries we know are providing stats we know are correct. |
|
|
|
|
BabyCat
V.I.P. Member
Joined: January 26 2020 Status: Offline Points: 15175 |
Post Options
Thanks(2)
Quote Reply
Posted: February 12 2020 at 8:01am |
|
Thanks for the kind encouragement. I'm just a regular person trying to draw my own conclusions, do my own thinking - something I think is good for everyone to do, rather than rely on the (mis)information all around the globe are fed. It's not that hard when you try. In a new situation, even the so-called experts sometimes are just guessing. The more information you have, the better you can decide for yourself. I'm sure there are millions of people in Hubei province that wish they were told the truth and would have protected themselves.
The world is in a false lull, I fear.    |
|
|
|
|
Pandemic
Adviser Group

Joined: January 31 2020 Location: UK Status: Offline Points: 2725 |
Post Options
Thanks(0)
Quote Reply
Posted: February 12 2020 at 8:45am |
|
Excellent graphs.
|
|
|
|
|
Glupa
Adviser Group
Long term valued member Joined: January 28 2020 Location: SW Virginia Status: Offline Points: 1030 |
Post Options
Thanks(0)
Quote Reply
Posted: February 12 2020 at 3:00pm |
|
Though I’m certain I’m not the first or only person to have this aha moment I thought I’d post it anyway because it may interest some.
I was born and raised in the US and even though I’ve done some interesting traveling I still and likely always will think from a US point of view. More broadly, I think from a Northern Hemisphere point of view; economically, socially, politically, and this was my aha moment, meteorologically. The Covid-10 virus doesn’t do well in warm weather. Great! I’ve just got to get to May. The virus will start to go away in April. Even better! I can celebrate a virus free birthday. But summer for me is winter for the folks in the Southern Hemisphere. What’s great for me isn’t so great for the folks in the distant southern part of this planet. I know that we partly predict our winter flu preparations based on what happens to those whose winters coincide with our summer. Won’t it also be true for this virus? And if so, isn’t it concerning that many of the countries that will be experiencing winter later this year are developing nations with lesser equipped health care systems? I hope I’m way off base here but worry I’m not. |
|
|
|
|
BabyCat
V.I.P. Member
Joined: January 26 2020 Status: Offline Points: 15175 |
Post Options
Thanks(0)
Quote Reply
Posted: February 12 2020 at 4:27pm |
|
Conclusions, youth are generally safe, China now reporting clinically diagnosed cases (ex: with radiography, etc.), leading to enormous surge in official cases. We all knew the numbers were underreported. Expect deaths to increase proportionally. CFR edging closer to 4-5%
  
|
|
|
|
|
BabyCat
V.I.P. Member
Joined: January 26 2020 Status: Offline Points: 15175 |
Post Options
Thanks(0)
Quote Reply
Posted: February 12 2020 at 8:13pm |
|
This is one of the strangest charts. It suggests severe data misreporting. reality is probably 5-10x higher, in my opinion.
China is still lying - they are not counting those who are confirmed via testing but do NOT have any clinical diagnosis. Thus, missing, if the virus is infecting, but only mildly or little symptoms in about 80%, then the numbers would be, by logic at least 4x higher than confirmatory and symptomatic. 
|
|
|
|
|
pheasant
Admin Group
Joined: May 20 2006 Location: Florida Status: Offline Points: 9851 |
Post Options
Thanks(0)
Quote Reply
Posted: February 13 2020 at 2:41am |
|
Just for curiosity, what would the graph and r0 look like if the spike( extra cases) were evened out?
What I'm asking is if the 2-2.1 curve is manipulated, what would it be if theses cases had been reported? |
|
|
The only thing we have to fear, is fear itself......FDR
|
|
|
|
|
EdwinSm,
Moderator
Joined: April 03 2013 Status: Offline Points: 24065 |
Post Options
Thanks(0)
Quote Reply
Posted: February 13 2020 at 3:18am |
On the graph below you can envision a line from about 6th February to the latest figures. Around the 6th February is when the upward curve of cases started to flatten out. [This is my not very scientific eye-balling the figures answer]. So may be around that time they stopped being able to test all the suspected cases????? 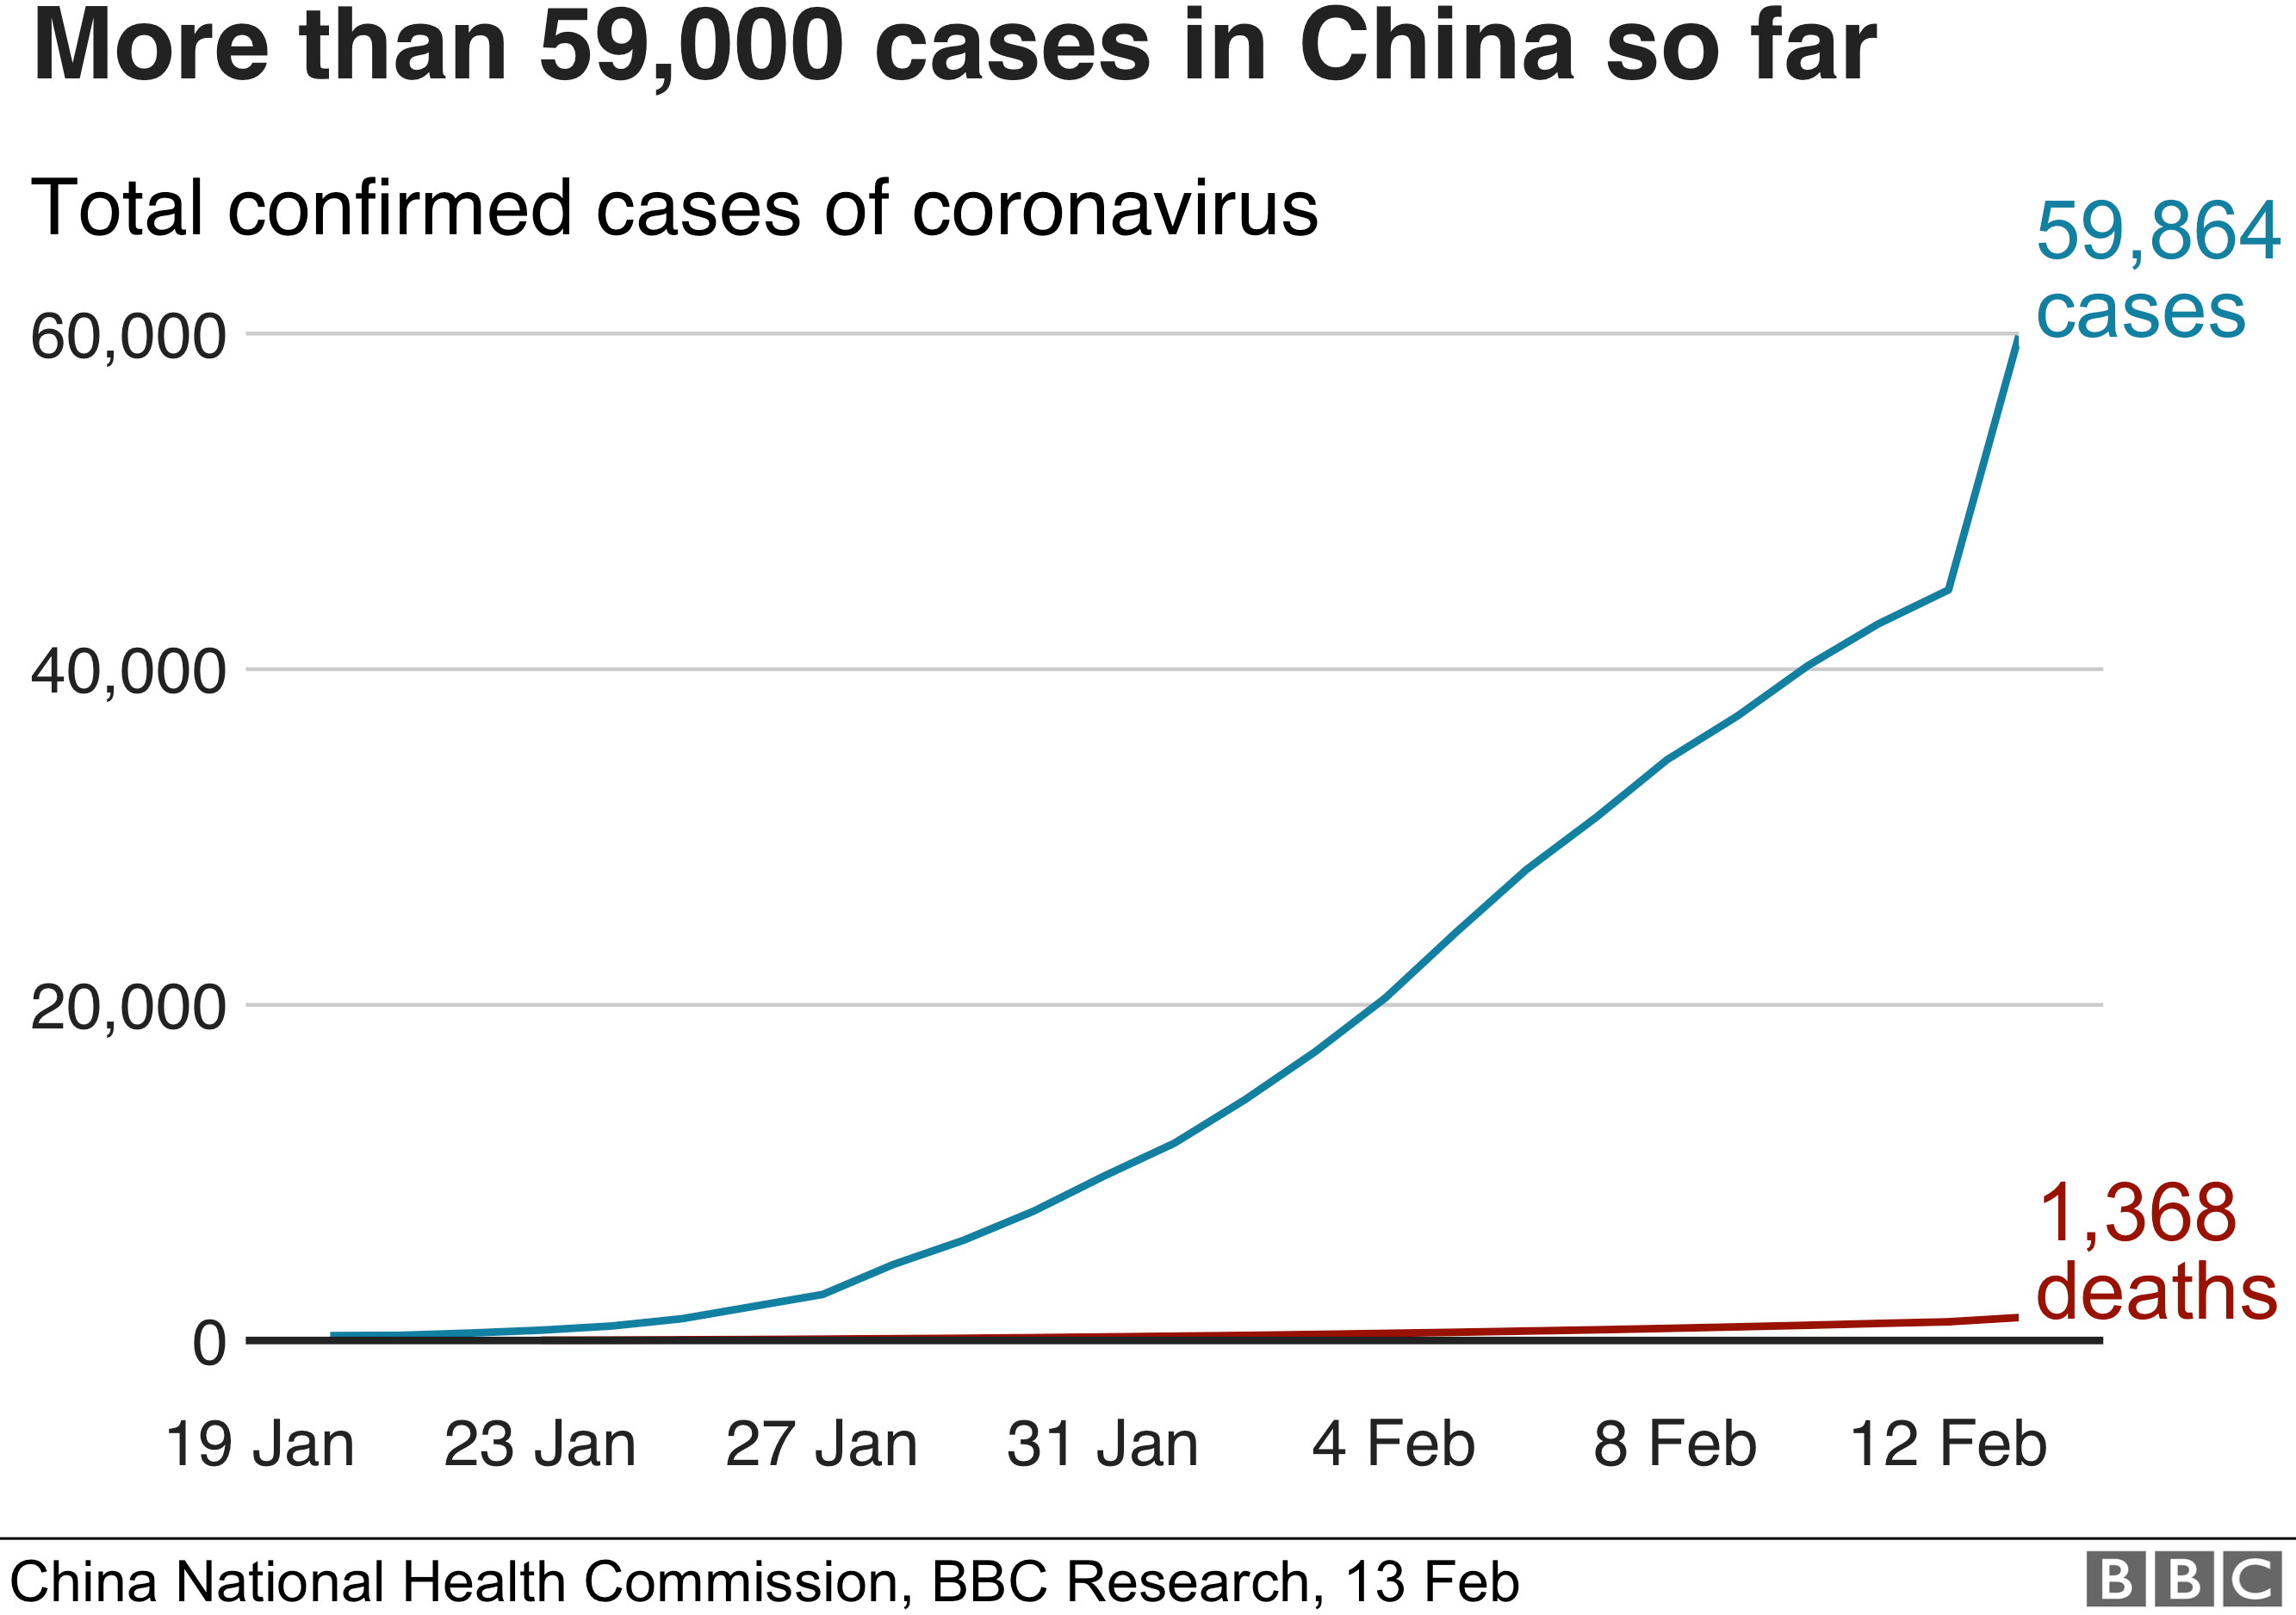 ps. sorry, I don't know how to scale this. |
|
|
|
|
BabyCat
V.I.P. Member
Joined: January 26 2020 Status: Offline Points: 15175 |
Post Options
Thanks(0)
Quote Reply
Posted: February 13 2020 at 6:21am |
|
Heads up to all. Expect dramatically increased numbers out of Japan and Singapore, followed shortly by Hong Kong, where I believe the virus is now firmly out in the wild in a sustained H2H, and has outrun the attempt to contain it.
Expect numbers there to rise dramatically in the next two weeks, with increasingly alarming implications. Expect Japan to react vigorously, and enact countrywide shutdowns and distancing. Air travel from Japan by other countries may be curtailed in next 2-3 weeks as a result. Also, expect a country or two to suddenly report dozens of cases "out of the blue", like Indonesia, or India. Perhaps other unrecognized hotspots. Simultaneously. internationally, when testing is more available and widespread, numbers will also climb, including the US. I expect to be close to the 8-day predicted numbers, 1000 international cases by the 16th. |
|
|
|
|
ME163
Admin Group
Joined: September 16 2006 Status: Offline Points: 4552 |
Post Options
Thanks(0)
Quote Reply
Posted: February 13 2020 at 6:31am |
|
The numbers never matched up with the exponential curve. I still don't think the numbers are anywhere near the true numbers. Neil fergusons models show the true path of the virus.
|
|
|
|
|
BabyCat
V.I.P. Member
Joined: January 26 2020 Status: Offline Points: 15175 |
Post Options
Thanks(0)
Quote Reply
Posted: February 13 2020 at 6:33am |
|
In the US, I am taking increasing precautions, as I have been traveling through airports and areas with confirmed cases. Remember, there is not enough testing right now, and we may be like Wuhan in early December. Unfortunately, right now, it seems that that our "wait and see" approach is a mistake, instead of "check and know."
|
|
|
|
|
BabyCat
V.I.P. Member
Joined: January 26 2020 Status: Offline Points: 15175 |
Post Options
Thanks(0)
Quote Reply
Posted: February 13 2020 at 6:44am |
Yes, Neil has it right I think. The confirmed cases represent just the identified cases, in Western countries he estimates it's catching about 20-25%, 1 out of every 4 or 5. That leaves a lot of potential cases spreading disease at this very moment. Right now is the time for vigilance. It's right now, before cases get confirmed is the time of increased danger, because people are not wearing masks, or taking other precautions. I'm sure people in Wuhan would have reacted differently had they known how widespread it was. If you are in a remote rural area in the US, you're likely fine. But, I, myself, would certainly wear a mask in and around airports with high historical travel from Wuhan/Hubei province, Uber/Lyft drivers and hotels, for example. In two weeks, the numbers could go 1 -> 3 -> 9 -> 27 -> 81 -> 241, and by then, maybe only 20% are feeling any symptoms, and of those, a handful long enough and serious enough to go to the doctor, and maybe 1 or 2 of those starts getting attention about the possibility of coronavirus. |
|
|
|
|
BabyCat
V.I.P. Member
Joined: January 26 2020 Status: Offline Points: 15175 |
Post Options
Thanks(0)
Quote Reply
Posted: February 13 2020 at 7:03am |
|
Some new logarithmic charts. Interesting. Internationally, started off more exponentially, then tapered. Not sure if it will sustain that new leveled trend, but I rather doubt it. I think it just reflects relatively minimal testing in many places at this point.
  
|
|
|
|
|
BabyCat
V.I.P. Member
Joined: January 26 2020 Status: Offline Points: 15175 |
Post Options
Thanks(0)
Quote Reply
Posted: February 13 2020 at 8:00am |
|
Apparently, I'm not the only one who thinks China's official infection and death counts are "severely underreported" Ask about any expert, they'll say the same thing.
-- "Update (1015ET): Following last night's debacle over China reporting, Fox News' Edward Lawrence reports that administration sources say they believe China is under reporting the number of coronavirus cases by at least 100,000 in China. Administration sources say they believe China is under reporting the number of #coronavirus cases by at least 100,000 in China. Also sources say the administration believes China is "severely" under reporting the number of deaths from the virus. — Edward Lawrence (@EdwardLawrence) February 13, 2020" --- Here's my view of things: 
|
|
|
|
|
BabyCat
V.I.P. Member
Joined: January 26 2020 Status: Offline Points: 15175 |
Post Options
Thanks(0)
Quote Reply
Posted: February 13 2020 at 8:38am |
|
"Eric Feigl-Ding
@DrEricDing · 2h Singapore 🦠 epidemic expanding: 8 more, up to 58. More than half now local community human to human transmissions, unrelated to China. Oy." |
|
|
|
|
BabyCat
V.I.P. Member
Joined: January 26 2020 Status: Offline Points: 15175 |
Post Options
Thanks(0)
Quote Reply
Posted: February 13 2020 at 8:42am |
|
Bad news from China CDC. They say CFR 4.45% for men, and Ro of 3.77.
My conclusion: Kick prepping into high gear!! Authorities are now seeking to only delay pandemic, minimize outbreaks as much as possible. As I stated weeks ago, this is a monster. The monster is out of the cage. If even 1% CFR, and spreads widely, it will be a disaster unlike we've seen in 100 years since the 1917-18 Influenza epidemic. We are running out of time. -- "Eric Feigl-Ding @DrEricDing Public health scientist / Epidemiologist / Health Economist / Harvard & JohnsHopkins alum / Taught 15yrs HarvardSPH / NYT-pharma whistleblower / #COVID19 info VA & Washington DCscholar.harvard.edu/ericdingJoined January 2009 3,495 Following 82.2K Followers Eric Feigl-Ding’s Tweets Eric Feigl-Ding @DrEricDing · 2h Eric Feigl-Ding @DrEricDing · Feb 12 I’m not certain this is the real final #COVID19 CFR. I’m concerned because we all know there’s huge numbers of underdiagnosis not tested for 🦠would lower it. And 80-90% cases not resolved yet, which could boost it upwards. @MRC_Outbreak says CFR likely 1%. Let’s wait for final#. Quote Tweet Andy Biotech @AndyBiotech · Feb 12 Largest study to date from China CDC of first 4021 laboratory confirmed cases w/ #2019nCoV #COVID19 from 30 provinces R0 ~3.77 (95% CI 3.51-4.05) Case fatality rates (CFR) ~3.06% with significant gender difference - Male 4.45% - Female 1.25% https://medrxiv.org/content/10.1101/2020.02.10.20021675v1 |
|
|
|
|
BabyCat
V.I.P. Member
Joined: January 26 2020 Status: Offline Points: 15175 |
Post Options
Thanks(0)
Quote Reply
Posted: February 13 2020 at 11:32am |
|
Scott Gottlieb, MD
@ScottGottliebMD "This is cumulate growth in #COVID19 cases on Diamond Princess post forced quarantine vs. cumulative growth in Hubei cases from time zero of Wuhan’s forced quarantine Jan 23. It’s a crude graphic we created, so interpret very cautiously, but gives some insight into relative spread" 
|
|
|
|
|
BabyCat
V.I.P. Member
Joined: January 26 2020 Status: Offline Points: 15175 |
Post Options
Thanks(0)
Quote Reply
Posted: February 13 2020 at 11:34am |
|
Looks to be doubling every 2.5 days
|
|
|
|
|
BabyCat
V.I.P. Member
Joined: January 26 2020 Status: Offline Points: 15175 |
Post Options
Thanks(0)
Quote Reply
Posted: February 15 2020 at 3:24pm |
|
Today, Feb 15 (half-way through the day), at 707 cases.
My prediction of 1000 by the 16th was too high, although relatively speaking, not too far off. It'll happen a few days later, but curve and trend line can be clearly seen. I think right now it's a matter of testing and confirmation. Once more extensive testing is in place (it's getting ready at the moment - such as testing in the US for SARS nCoV-2 if flu test is negative), I think we'll see more confirmations. A few prayers that the exponential rise delayed at this point couldn't hurt. The first chart is linear scale, the second logarithmic. You can clearly see the exponential rise in the first chart. For the second, simply draw a straight fitting line on the logarithmic chart and see when and where we might be.  
|
|
|
|
|
BabyCat
V.I.P. Member
Joined: January 26 2020 Status: Offline Points: 15175 |
Post Options
Thanks(0)
Quote Reply
Posted: February 15 2020 at 3:29pm |
|
Perhaps one of us has time to plot the prediction line so for the second logarithmic chart. The slope is pretty clear. I haven't seen that anywhere else yet.
|
|
|
|
|
BabyCat
V.I.P. Member
Joined: January 26 2020 Status: Offline Points: 15175 |
Post Options
Thanks(0)
Quote Reply
Posted: February 15 2020 at 3:46pm |
|
Ok, I made a very crude chart (in Paint, hahaha, because I don't have time to do a decent job in Excel) to illustrate my point.
If current trend is maintained, may be looking at 10,000 confirmed infections outside of China by around Mar. 9. Of course, that's if the trend line is maintained, which is uncertain for many many reasons. Could be less, could be more. This is just what the data is indicating. 
|
|
|
|
|
Technophobe
Assistant Admin
Joined: January 16 2014 Location: Scotland Status: Offline Points: 88450 |
Post Options
Thanks(0)
Quote Reply
Posted: February 15 2020 at 3:49pm |
|
Great illustration!
I'm jealous of your abilites with data and data systems, BC. |
|
|
How do you tell if a politician is lying?
His lips or pen are moving. |
|
|
|
|
BabyCat
V.I.P. Member
Joined: January 26 2020 Status: Offline Points: 15175 |
Post Options
Thanks(0)
Quote Reply
Posted: February 15 2020 at 4:05pm |
|
Thanks. 10,000 infections by that time may seen a bit reassuring, however, soon thereafter we'll have exponentially rising infections in similar time periods -> 100,000; 1,000,000; 10,000,000; 100,000,000; 1,000,000,000 (1 Billion)....
If the earlier trend line had held, it would have been an obvious worldwide catastrophe by now. However, I think the lack of confirmed infections merely represents our limited worldwide testing at this point. |
|
|
|
|
Technophobe
Assistant Admin
Joined: January 16 2014 Location: Scotland Status: Offline Points: 88450 |
Post Options
Thanks(0)
Quote Reply
Posted: February 15 2020 at 4:18pm |
|
I agree.
For a test to work, you have to actually do it. People only seem to be being tested if they display symptoms - In China sometimes not even then! - so I suspect wuflu is massively unreported/recorded. |
|
|
How do you tell if a politician is lying?
His lips or pen are moving. |
|
|
|
|
Technophobe
Assistant Admin
Joined: January 16 2014 Location: Scotland Status: Offline Points: 88450 |
Post Options
Thanks(0)
Quote Reply
Posted: February 15 2020 at 4:19pm |
|
Of course, I could be wrong. That is the thing with a partial absence of testing. You have insufficient results to base your conclusions on.
|
|
|
How do you tell if a politician is lying?
His lips or pen are moving. |
|
|
|
|
BabyCat
V.I.P. Member
Joined: January 26 2020 Status: Offline Points: 15175 |
Post Options
Thanks(0)
Quote Reply
Posted: February 15 2020 at 4:37pm |
|
Agreed, but taking the cruise ship(s) as an example, extensive testing of exposure leads to greater confirmations. Looking at some of the "in the weeds" transmission reports, as Dr. Neil suggests, it's only the most serious cases getting tested at this point, and it seems most of their exposures were around mid Jan. to third week in January. We're playing catch up, and the monster is winning.
On another note, this recent paper says phylogenetic diversity reveals extensive dispersal of virus and epidemic doubling time of 7 days, and bad news about CFR: https://www.imperial.ac.uk/mrc-global-infectious-disease-analysis/news--wuhan-coronavirus/  
|
|
|
|
|
Technophobe
Assistant Admin
Joined: January 16 2014 Location: Scotland Status: Offline Points: 88450 |
Post Options
Thanks(0)
Quote Reply
Posted: February 15 2020 at 4:54pm |
|
For the non statistician. Baye's theorem is explained here: https://www.youtube.com/watch?v=XQoLVl31ZfQ It is from this theorem that Bayesian estimates are derived.
If that is too complicated, it is a probability calculation where one factor is at least approximately known. |
|
|
How do you tell if a politician is lying?
His lips or pen are moving. |
|
|
|
|
Technophobe
Assistant Admin
Joined: January 16 2014 Location: Scotland Status: Offline Points: 88450 |
Post Options
Thanks(0)
Quote Reply
Posted: February 15 2020 at 5:03pm |
|
Having stopped to give a clue or two to the non statistically minded.
Babycat, your statistical reasoning tallies with mine. I am using simpler models (I had to look up Baye's theorem) as I am no statistician, but I arrive at similar numbers. One of the rules of modelling is that the more models you use the more accurate you are (or the less in-accurate). All in all, I am in awe of your figures. |
|
|
How do you tell if a politician is lying?
His lips or pen are moving. |
|
|
|
|
BabyCat
V.I.P. Member
Joined: January 26 2020 Status: Offline Points: 15175 |
Post Options
Thanks(0)
Quote Reply
Posted: February 15 2020 at 5:58pm |
|
Update: I plotted the graph more carefully on log paper (I'm too lazy to enter the data in Excel or use an online graphing site), and we might see the number of infections outside of China to be:
1,000 by Feb. 19 10,000 by March 7th 100,000 by March 29 1,000,000 by April 16 10,000,000 by May 4 Rising by a factor of 10 roughly every 18 days or so. We'll soon see, of course. But I imagine that as confirmed cases rise past 5-10,000 worldwide, the world will start shutting down country by country, limiting travel, identifying essential goods (that means you won't be able to get some supplies you may need!), sheltering in place, just like China, or probably even before then. So, basically, the conclusion is...there is very little time remaining to prepare. Because once a decision to shut down/quarantine/shelter in place is made (and it's not YOUR decision), your options to leave and or prepare will be far more limited. Thus, very important to prepare now. Many Japanese are now beginning to limit social interaction, etc. |
|
|
|
|
BabyCat
V.I.P. Member
Joined: January 26 2020 Status: Offline Points: 15175 |
Post Options
Thanks(0)
Quote Reply
Posted: February 15 2020 at 7:26pm |
|
If you analyze this nice chart from @evdefender, you'll see that internationally, the world might be where China allegedly was back on Jan. 23. See how China grew from there, is the implication. That is, if you believe the Chinese numbers.

|
|
|
|
|
BabyCat
V.I.P. Member
Joined: January 26 2020 Status: Offline Points: 15175 |
Post Options
Thanks(0)
Quote Reply
Posted: February 15 2020 at 7:31pm |
|
On the 11th, I posted this:
"Today (11th, Day 4 of prediction) at 517 at this moment. Predicted 536. 18% still a bit too high. Probably around 15% increase every day, I hope it stays in this sub-exponential (somewhat linear) form. (However, epidemics typically begin in exponential until a certain point) Do the math from there. Even if stays sub-exponential, may get ugly, real soon. Maybe the rest of world dodges a bullet when Spring comes. Time will tell. Today 517 2 595 3 684 4 786 5 904 6 1040 7 1,196 8 1,375 9 1,582 10 1,819 11 2,092 12 2,405 13 2,766 14 3,182 15 3,658 16 4,207 17 4,838 18 5,564 19 6,498 20 7,358 21 8,461 A caveat, too, is that most of the new international infections are from the Japan cruise liner. However, I believe the high infection confirmations are because of confirmed exposure followed by aggressive testing. Other countries are not as aggressively testing such a defined sample set. In other words, they're not looking hard enough. Thus, significant undercounting or underreporting at the moment. The lull in the international storm. But, it's coming, I am convinced, and will unleash hell. Best to be prepared to battle now. On the 8th, I also used a graph to predict 1000 cases in 8 days (by the 16th). Over halfway there. (517). 5 more days to go. We'll see if it gets there, and which model wins out. " --- Which means my prediction in this model for today (Day 4) was at 786. Actual Day 4 (so far) is 768. Not a bad estimate! It looks like with all the extra surveillance and testing the offially confirmed infection rate at the moment is is sub-exponential at 15% each day. We'll see if and how long that holds. |
|
|
|
|
Post Reply
|
Page <1 34567 19> |
 Tweet
Tweet
|
| Forum Jump | Forum Permissions You cannot post new topics in this forum You cannot reply to topics in this forum You cannot delete your posts in this forum You cannot edit your posts in this forum You cannot create polls in this forum You can vote in polls in this forum |


 Topic Options
 ME163 wrote: